
Blog Post < Previous | Next >

Housing Price Index
International Housing Bubble scaled to Income
A brief explanation of what we are looking at
Let’s say over a given period a country’s house prices increase by 30% and income also increases by 30%. If you divide house price by income, house prices remained constant relative to income.
Looking at house prices’ increase alone, you may conclude you are dealing with a housing bubble. But, when scaling such house prices to income, you observe that this ratio has remained unchanged.
Within this essay, I will look at house prices both ways.
Content
I will compare house prices for 9 different countries:
- US
- Canada
- UK
- Australia
- New Zealand
- Belgium
- France
- Ireland
- Sweden
And, I will compare house prices over the following periods:
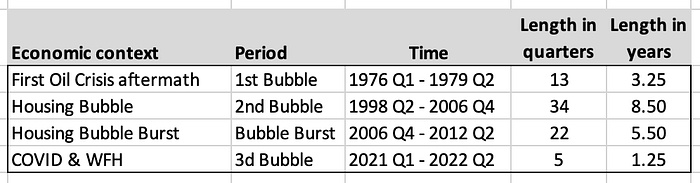
I have defined the bubbles’ time periods focusing on the US house price divided by income measure. If I had focused on house price alone, I would have segmented the time periods slightly differently. If I had focused on a different country, I may have segmented the time periods very differently. But, I am interested in comparing countries’ housing trends to the US ones over the specified periods.
The Data
The Federal Reserve Bank of Dallas has excellent data at its International House Price Database. It has extensive house price index data on numerous countries. And, it also has income data for these same countries. The Dallas Federal Reserve income metric is personal disposable income (PDI).
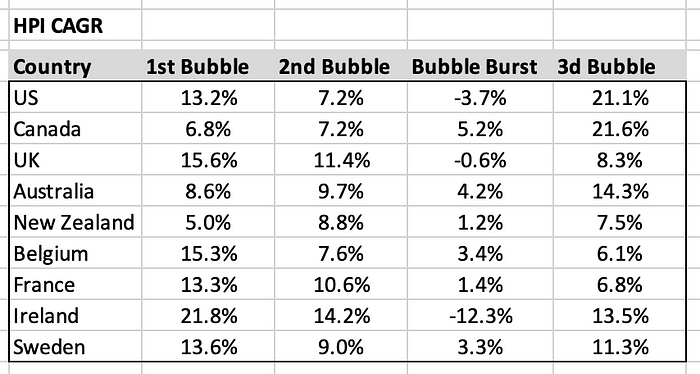
Summary results focusing on CAGR
The table below discloses the compounded annual growth rate (CAGR) in house price index (HPI) over the four specified bubble periods. Notice that even though the bubbles were specified using the US time series, several countries’ house prices bubbled much more than the US ones (on the way up and the way down).
I also looked at house prices scaled to income by dividing HPI by PDI.
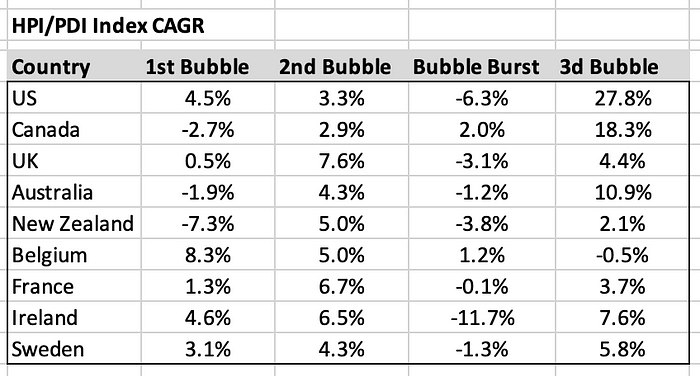
Most often, the HPI CAGR is greater than the HPI/PDI Index CAGR. However, at times the latter can be higher than the former. This can occur when the PDI decreases over a given period.
Now let’s visualize these trends to better understand the data.
House Price Index over the different Bubble periods
First Bubble

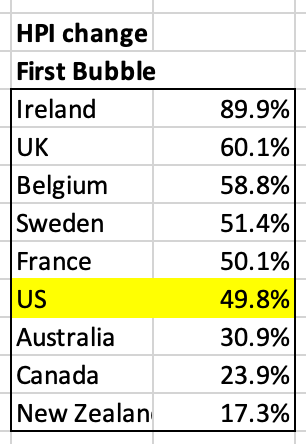
During the First Bubble, European countries bubbled more than the US, and Canada and Down Under bubbled less.
Second Bubble — Housing Bubble
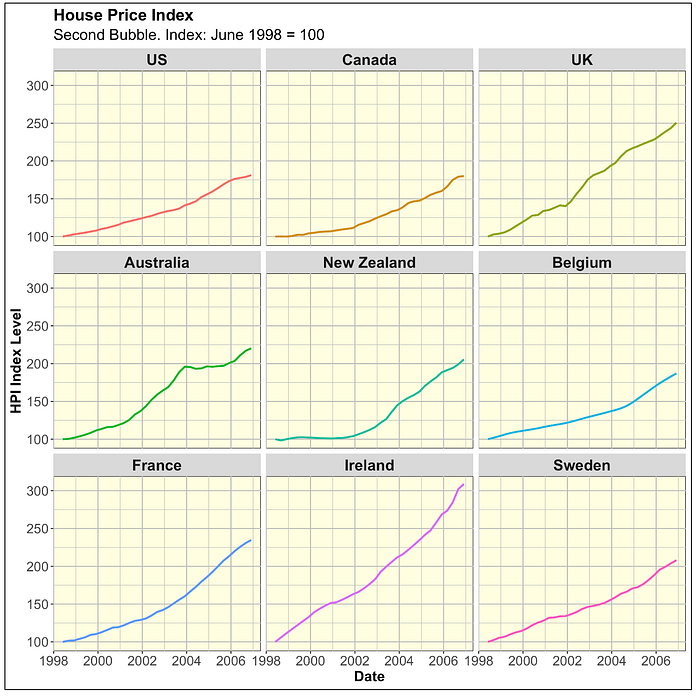
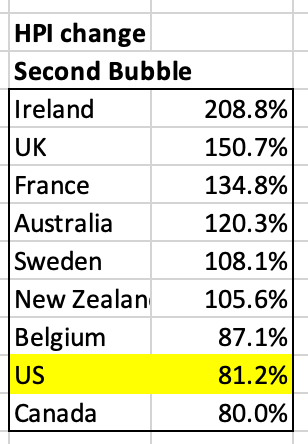
During the Housing Bubble, the US is very near the bottom with Canada. Meanwhile, Ireland experienced a spectacular increase in house prices (+ 208.8%) more than twice the increase for the US (+ 81.2%).
Housing Bubble Burst
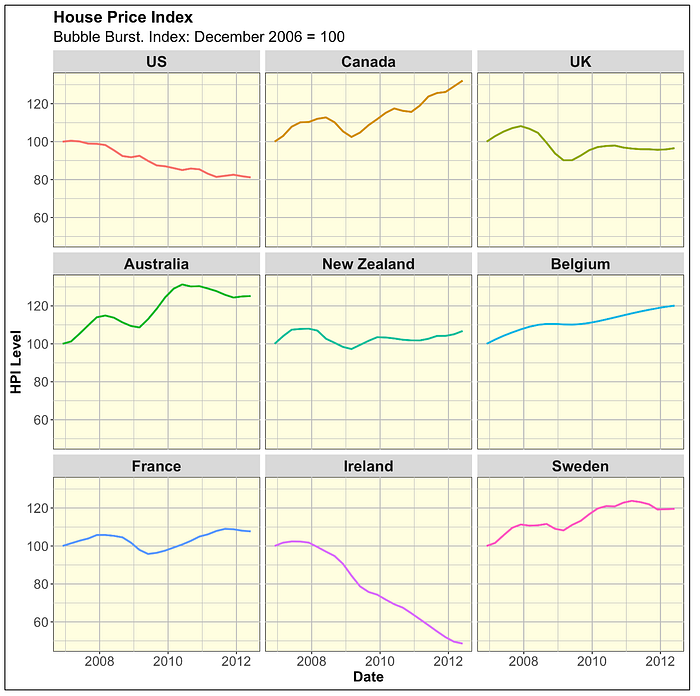
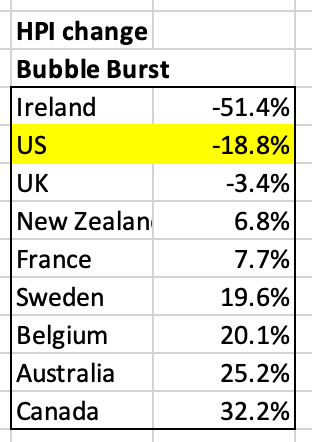
During the Housing Bubble Burst, Ireland experienced a spectacular contraction (-51.4% decline in house prices). The US was in second place (-18.8% decline). UK was in third place (-3.4%). Surprisingly, the other six countries experienced an increase in house prices during the Bubble Burst period.
It only makes sense that Ireland’ house prices cratered during the Housing Bubble Burst (- 51.4%) since they had bubbled by far the most during the preceding Housing Bubble (+ 208.8%).
Third Bubble — COVID & WFH
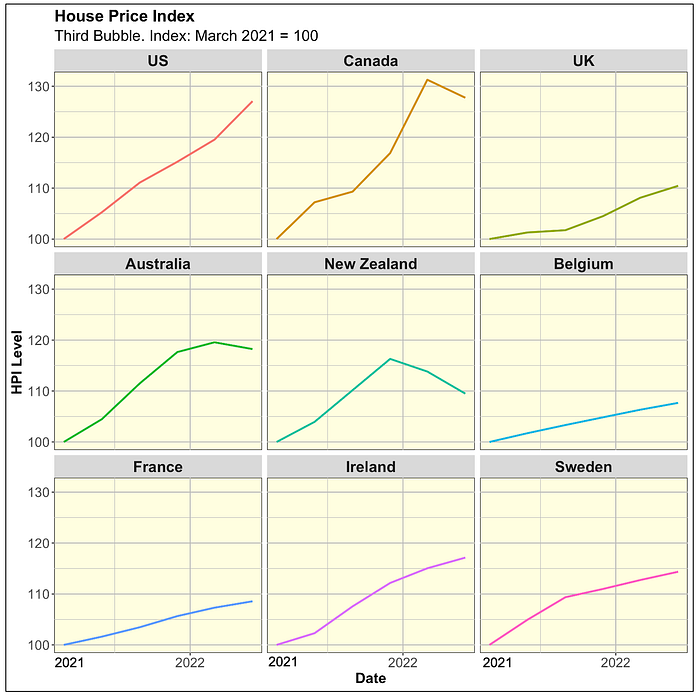
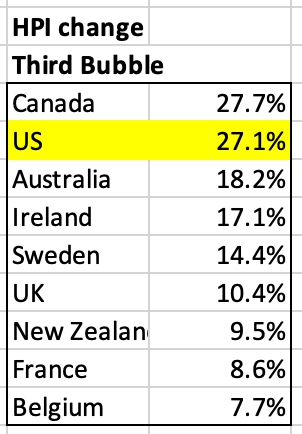
During the COVID & WFH Housing Bubble, the US and Canada take the lead with house price increases of over 27% during this five quarter period (little over a year).
HPI/PDI over the different Bubble periods
First Bubble
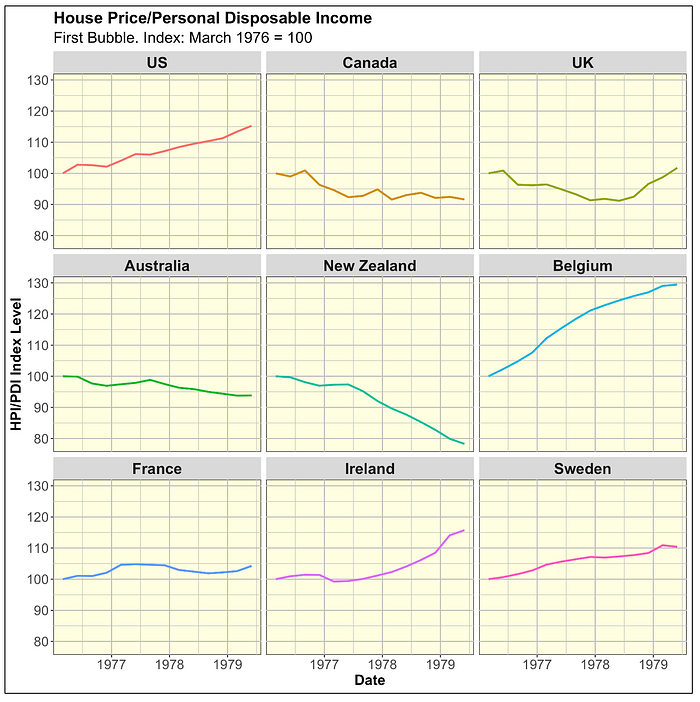
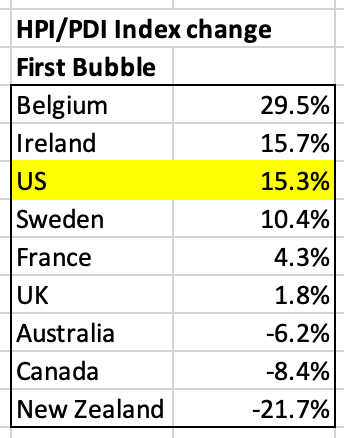
During the First Bubble, Belgium, Ireland, US, and Sweden experienced increases in the HPI/PDI index. This means that relative to income, houses became increasingly expensive. Meanwhile, Canada and Down Under experienced a decline in the same measure indicating that houses became more affordable relative to income within these countries.
Second Bubble — Housing Bubble
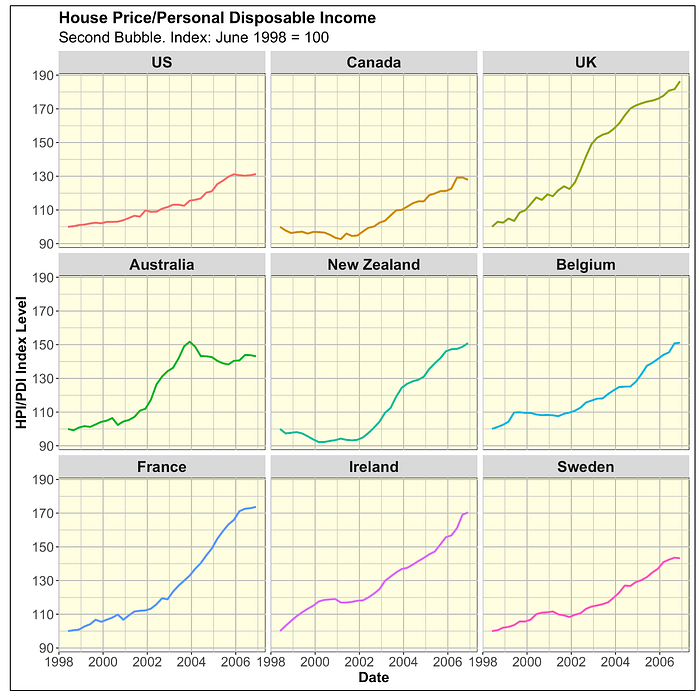
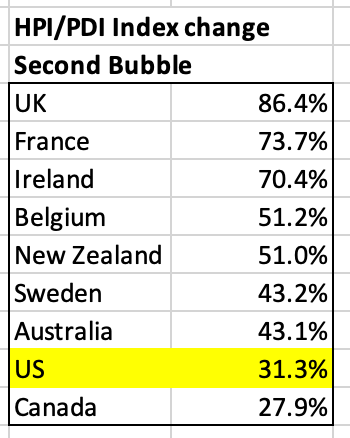
During the Housing Bubble, all countries experienced a rise in the HPI/PDI Index measure. This means that houses relative to income became less affordable everywhere. The US and Canada experienced the least bubbling on this measure. Thus, on a relative basis houses became somewhat less unaffordable relative to income compared to the other countries.
Housing Bubble Burst
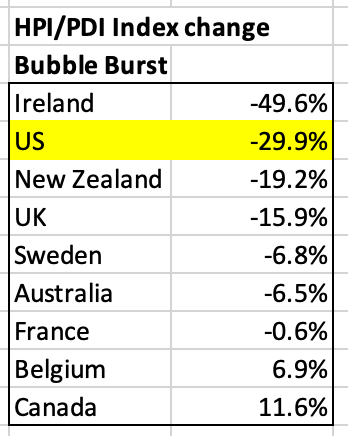
During the Housing Bubble Burst period, Belgium and Canada’s HPI/PDI Index measure kept on rising. That’s unlike for the other seven countries that experienced a decline in this same measure as one would expect.
Third Bubble — COVID & WFH
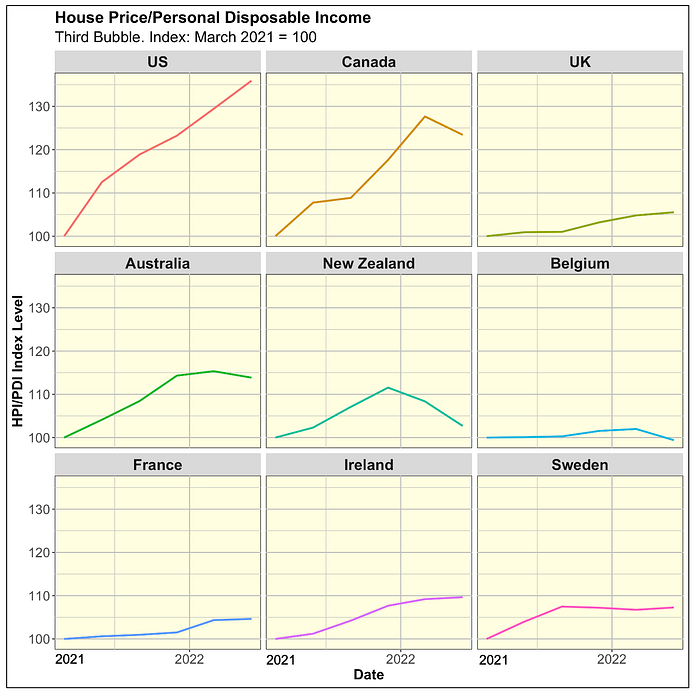

When it comes to the Third Bubble [COVID & WFH], the US stands at the top. As the HPI/PDI Index rose the fastest over just a 5 quarter period. This suggests that house prices became increasingly more unaffordable in the US vs the other countries during this period.
Considerations
House prices in New York, San Francisco, Toronto, Vancouver, Melbourne, Sydney, and London most probably bubbled on the way up and down a lot more than their respective national indices suggest.
The variance in bubbling between cities within one country can be as great or greater than the variance in bubbling between countries.
Ireland’s house prices volatility is a true outlier. There are many economics, demographics, and tax policy factors explaining this volatility. For more on the subject, check out Perplexity’s answer.
https://www.perplexity.ai/search/can-you-explain-why-ireland-s-BFaxj8acQveYX6QgKMlhyg
When it comes to house affordability, the elephant in the room is the level of mortgage rate in each country. Gathering this rate data for each country was beyond my bandwidth on this project. In an earlier study comparing the four largest US States (California, Florida, New York, Texas), I had done that (using mortgage rate to figure out housing affordability).
THE END

Gaetan Lion is an independent researcher with expertise in economics, econometrics, investments, risk management, statistics, and quantitative analysis. His areas of interest include demographics, economics, investments, Climate Change, health care, sports, and politics.