
Blog Post < Previous | Next >

Bureau of Labor Statistics
Tariffs Tantrums
Tariffs tantrums will break up the US cost effective supply chains, blow up World trade, and cause stagflation (higher inflation combined with recession). And, they will not increase manufacturing jobs.
Automation is shrinking manufacturing employment
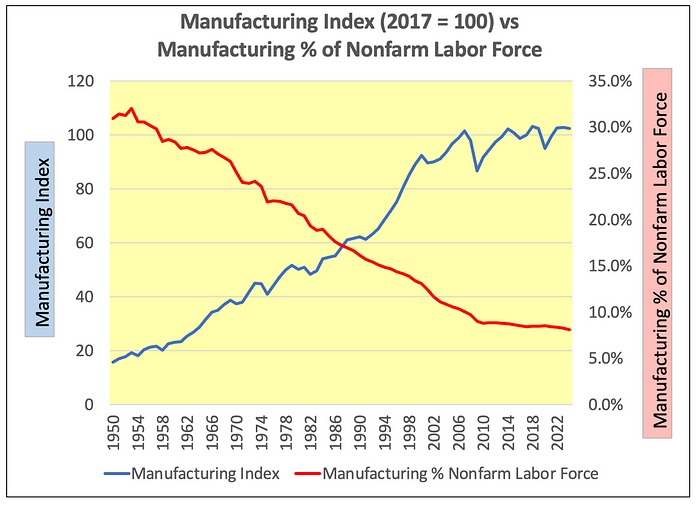
As shown on the graph below, the US produces about 7 times more stuff than it did in 1950
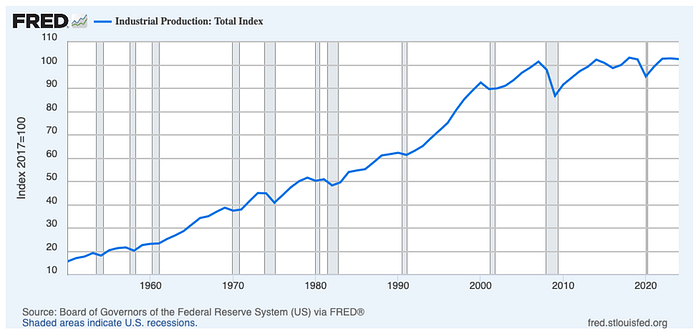
Over the same period, manufacturing has decreased from 32% to 8% of the labor force due to automation.
Re-shoring manufacturing will not boost manufacturing employment. Honda and Toyota developed numerous auto plants throughout the South from the late 1980s to the early 2000s to circumvent tariffs on Japanese exports to the US. And, this did not make a dent in the long term decline in manufacturing employment as a % of the labor force. This is because of automation.
Additionally, on the supply side we just don’t have the slack in the labor force to shore up manufacturing employment count. You are not going to get Government employees DOGEd out of their job into factories.
Trump is obsessed by the wrong metric: Trade Deficit
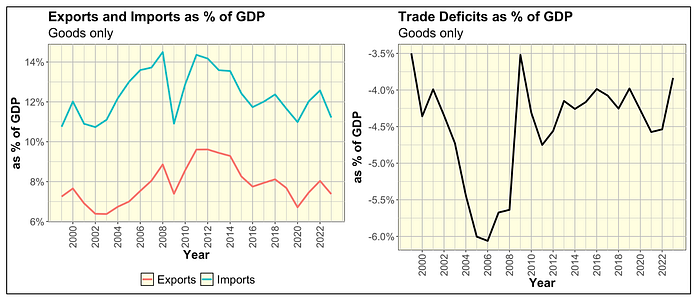
Since 1999, the US has typically run a Trade Deficit of — 4% of GDP associated with exports coming at around 8% and imports at 12%.
Trump believes he can fix the Trade Deficit by imposing tariffs on various countries. This will not work. It will only reduce World Trade and economic growth for everyone. It will also exacerbate the risk of recession in the US and around the World.
Back in 1930, the Smoot-Hawley Tariff Act caused a collapse of World Trade and exacerbated the Great Depression.
Trade Deficit = Capital Surplus
Trump is fixated on trade deficits like they are golf scores. And, that US is on the losing side of the game. But, international trade is not golf.
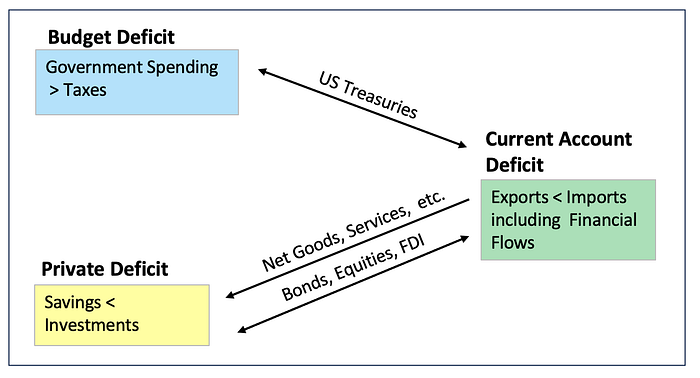
- The US Budget Deficit consists in Federal Government spending being much higher than Federal tax receipts. To finance this gap, the US issues a huge amount of US Treasuries. Foreigners have reinvested part of their dollar proceeds from their net export to the US into such Treasuries. Over the past couple of decades, foreigners have held between 30% to over 50% of US Treasuries outstanding
- The US Private Deficit is when domestic savings fall short of domestic investments. To finance this gap, businesses issue securities (bonds, equities). Foreigners have reinvested part of their dollar proceeds from their net export to the US into such bonds, equities, and foreign direct investments. Within this context, private savings means the sum of individual savings (disposable income minus consumption) and business savings (retained earnings). And, investments means business capital expenditures to build capital assets such as buildings, factories, data centers, etc. to boost the production and productivity of their enterprises
- The US Current Account Deficit is a broad measure of international trade deficit. It includes the trade of goods, services, and cross border financial flows.
Given that the US runs chronically large Budget Deficits and Private Deficits, it is inevitable that it also runs large Trade Deficits. And, this really upsets Trump. We shall soon explain why it really should not.
Let me revise the previous diagram to render it a bit clearer.
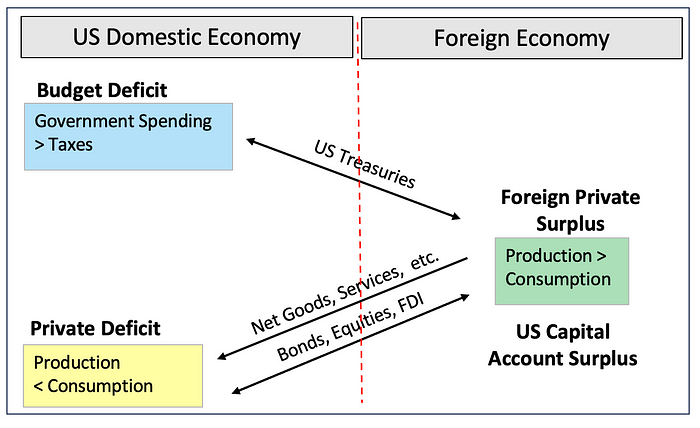
Within the above diagram I redefined the Private Deficit as simply US production being lower than US consumption.
I also redefined the US Current Account Deficit as the Foreign Private Surplus with foreigners’ production exceeding their consumption. And, also defining it as the US Capital Account Surplus, as foreigners reinvest the proceeds from their trade surplus with the US in US securities (bonds, equities) and foreign direct investment.
This economic structure results in consistent US trade deficits (Current Account Deficits), balanced by high Capital Account Surpluses from foreign investments. Far from being a weakness, this inflow of foreign capital underscores the strength and global appeal of the US economy.
Let me further explain by illustrating Apple’s business model and the Smile Curve. The latter is a modern extension of the theory of comparative advantage (David Ricardo, 1817).
Apple’s business model and the Smile Curve
The Smile Curve
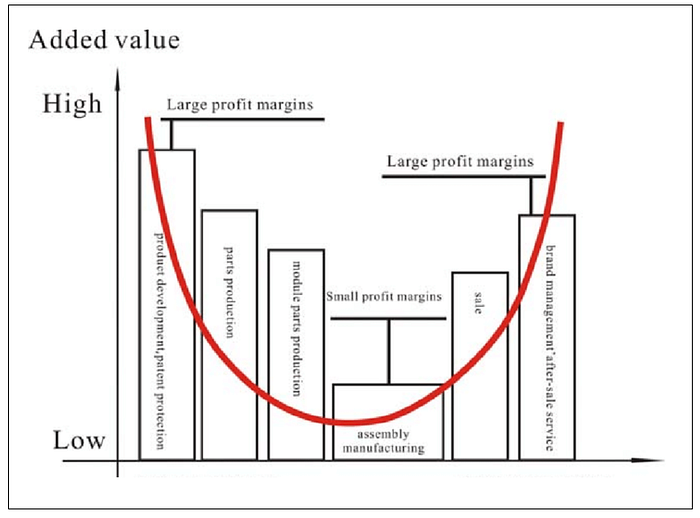
The Smile Curve illustrates that much of the value added in a product is captured by the upfront innovation functions (top left side of the smile) and the branding functions at the end (top right side). Meanwhile, manufacturing (at the bottom) is associated with the least value added and lowest profit margins.
Apple has been a master at leveraging the Smile Curve benefits. It innovates and develops its products in the US. And, also brands and markets its products in the US. Meanwhile, it manufactures its products in Asia. It does that because Asia’s manufacturing costs are far lower than in the US. By doing so, Apple can reinvest its savings from manufacturing into R&D (left side of the Smile Curve) and maintain its innovation lead in smartphones and other markets.
Apple’s Smile Curve business model has allowed it to become one of the most profitable and highly capitalized corporations in the World.
If you scale up Apple’s Smile Curve business model at the national level, it does translate into the US having a massive trade deficit in goods but also an equally massive capital surplus. The Asians who export IPhones back to the US reinvests the dollar proceeds from their US exports into US Treasuries, corporate bonds, and stocks. And, that’s where the US capital surplus comes from.
The Asian economies produce far more than they consume. Thus, their economies are very much export driven. And, the US benefits by being able to manufacture their stuff at a far lower cost than it could domestically. Apple has figured this out.

Is the US on the optimal side of the Smile Curve? It most probably is
At least until the recent tariffs tantrums…
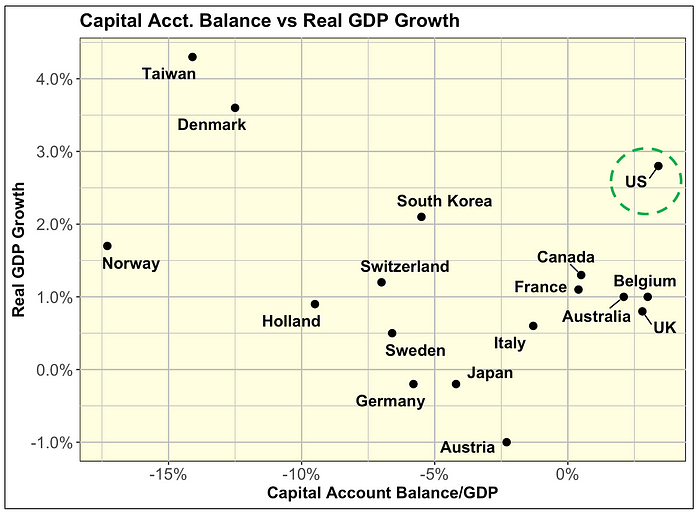
Using the most recent economic data provided by The Economist, the US has one of the highest economic growth associated with the highest Capital Surplus. That’s very much a scaling of the Apple Smile Curve business model. Most of the other countries have much lower economic growth and most often a Capital Account Deficit. They produce more than they consume. They export their excess capacity to the US. They also inject capital in the US as they reinvest the proceeds from their net exports into US securities.
Trump is oblivious to the above as he focuses solely on the Trade Deficit that obfuscates the tremendous benefits of the Apple Smile Curve business model. As we speak Trump’s tariffs considerations may very well throw the US into a recession in the very near future. He is already blaming this potential occurrence on the supposed economic mess left by the Biden Administration. However, nothing could be further from the truth. Biden left a US economy doing very well on most count. I reviewed this situation in an earlier article.
Trump’s tariffs tantrums are attacking its main trading partners: Canada and Mexico. Until now, the US, Canada, and Mexico made for one of the most formidable, integrated, free-trading blocks in the World. As we speak, Trump is dismantling this formidable block. And, it will profoundly impair all three economies.
The US/Canada/Mexico trading block
Canada and Mexico combined are by far the largest trading partners of the US. They are much larger than China and all of Europe.
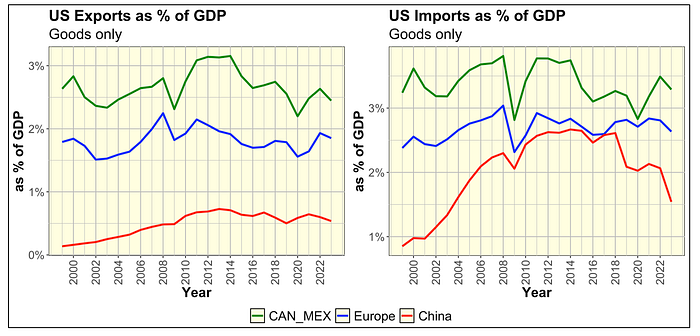
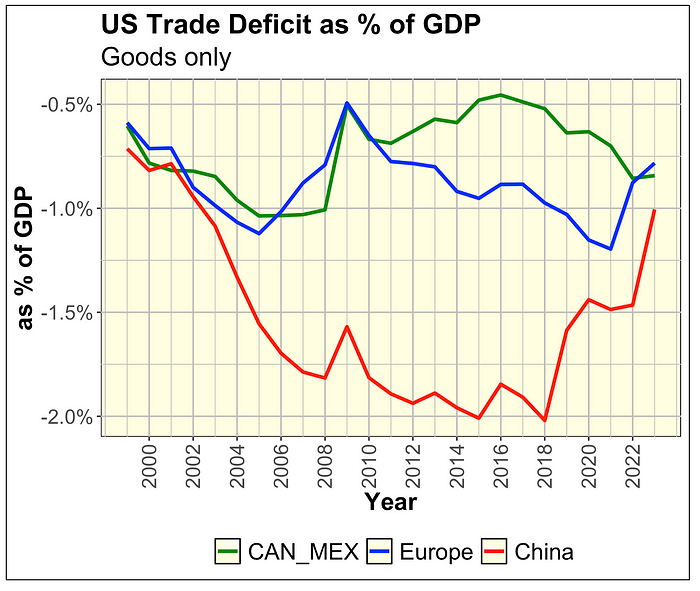
The graph below shows exports and imports as a % of US GDP with the three different blocks:
- Canada and Mexico (green)
- Europe (all of Europe combined) (blue)
- China (red)
When Trump imposed tariffs on Chinese goods in 2018, Chinese imports dropped abruptly from 2.5% to 1.5% of US GDP (right-hand graph, red line). However, US imports from Canada, Mexico, and other countries increased to balance the US ongoing Budget Deficit and Primary Deficit.
The graph below shows exports and imports as a % of total US exports or imports.
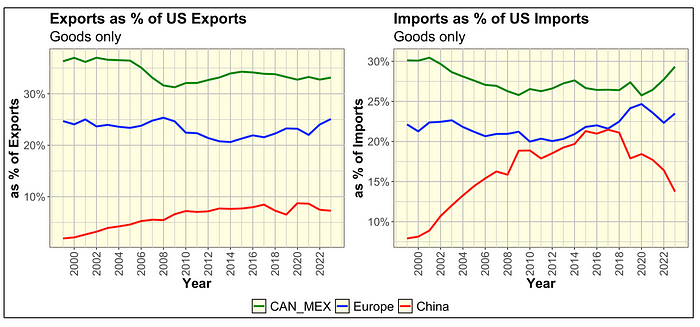
US trade with Canada and Mexico is better balance with a smaller trade deficit vs the ones with Europe and China. This renders Trump ire towards Canada and Mexico genuinely irrational.
Trade wars with Canada and Mexico, a bad idea
Trump’s attacking this trading block is an extremely bad idea on economic and strategic grounds. This is because the US faces significant economic vulnerabilities in its trade relationships with Mexico and Canada, particularly in sectors with deeply integrated supply chains and critical resource dependencies. Below are key pain points across main economic sectors:
Automotive Manufacturing
- Cross-border parts integration: About 30% of the value in vehicles imported from Mexico originates from U.S. workers and firms, with components like engines and transmissions crossing borders multiple times during production. A 25% tariff could raise manufacturing costs by $4,000-$10,000 per vehicle
- Strategic reliance: Ford CEO Jim Farley warned these tariffs could “blow a hole in the U.S. industry” due to North America’s unified production network, where 46% of Mexico’s manufacturing exports are tied to automobiles.
Energy resources
- Canadian crude oil: The U.S. imports 4 million barrels/day of Canadian crude (over 60% of total crude imports), critical for refining heavy oil in Gulf Coast facilities. Disruptions would raise gasoline price
- Electricity grids: Canada supplies 10–15% of U.S. electricity needs through an integrated grid system. Ontario’s 25% tariff on electricity exports threatens states like New York and Michigan that rely on Canadian hydropower
- Natural gas: Canada provides 30% of U.S. natural gas imports, vital for heating and industrial use in northern states.
Agriculture & Food Security
- Fertilizers: Canada supplies 85% of U.S. potash imports (main farming fertilizer), now subject to 10% tariffs under revised measures. If not for Canadian potash, American food production would be critically impaired
- Produce: Mexico accounts for 63% of U.S. vegetable imports and 47% of fruit/nut imports. Tariffs would directly increase grocery prices.
Intermediate Manufacturing Goods
- North American supply chains: 50% of U.S.-Canada-Mexico trade involves intermediate goods crossing borders multiple times. For example;
- Auto parts: Transmission modules and wire bundles may cross borders 5–8 times during production. The application of tariffs would not only devastate this trade, it would be a logistic nightmare
- Electronics/aviation: Specialized components like aircraft engines rely on machining and assembly processes across both Canada and Mexico. It would run into similar logistic challenges as auto parts.
Foreigners’ holdings of US securities
Foreigners’ holdings of US securities, in good part, describes the nature of the US Capital Account Surplus. The graph below shows the percentage of various US securities holdings held by foreigners.
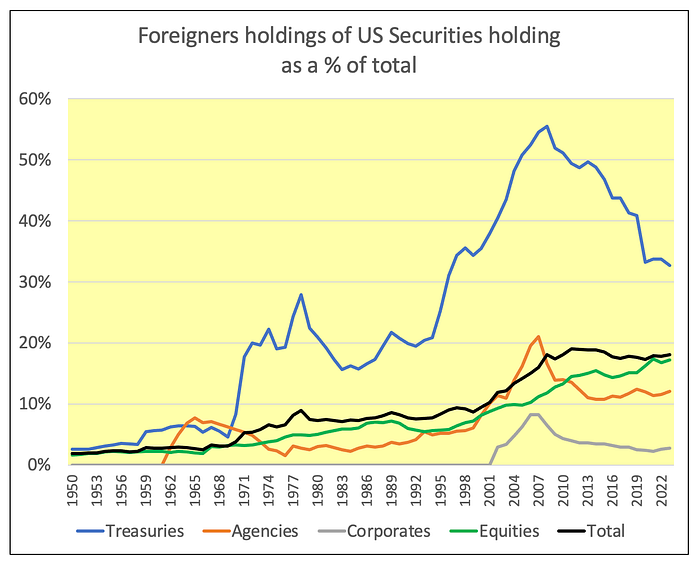
Within the above graph check out the black line-the percent of all securities held by foreigners. It grew from about 1.5% in 1950 to close to 20% since 2008.
Since 2008, foreigners have lowered their relative exposure to all US debt securities and increased their exposure to US equities. Meanwhile, their overall exposure to US securities has remained relatively constant at close to 20%.
Foreigners’ US securities preferences
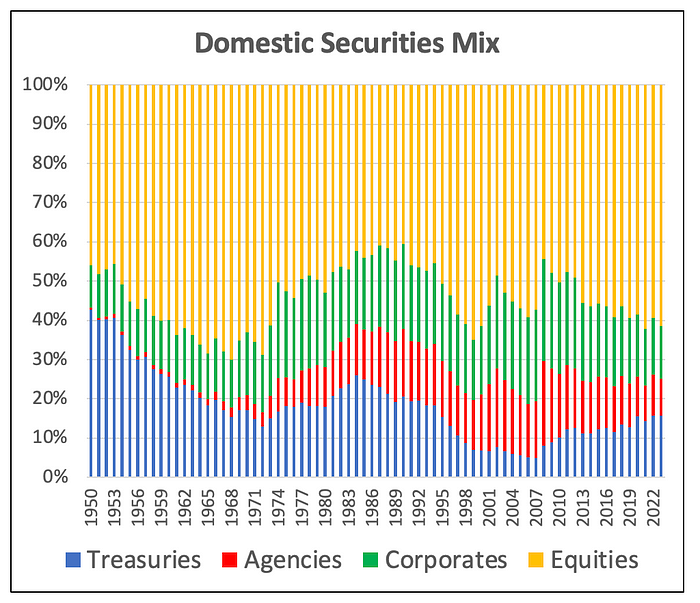
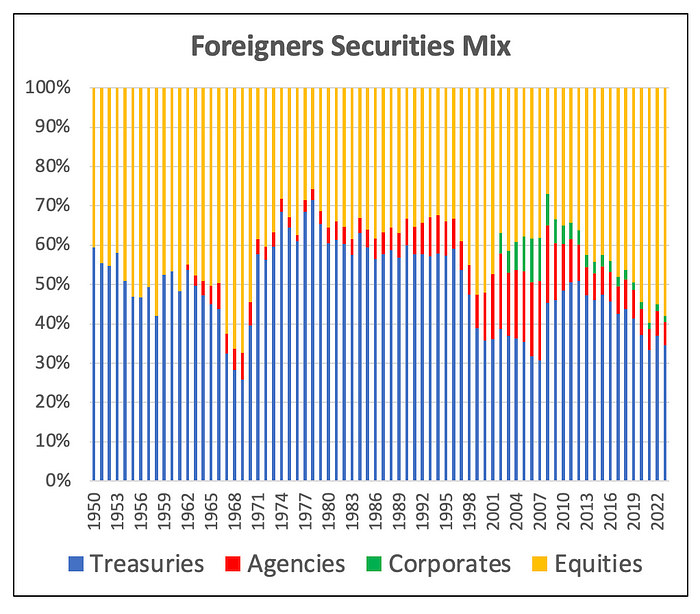
The graph below shows the securities mix of Americans. For the past 5 years the mix is about 60% equities and 40% debt securities.
The graph below shows the securities mix of foreigners. For the past few years the mix is also close to 60% equities and 40% debt securities. But, notice that within their debt instrument portfolios, they now hold almost only Treasuries. You can see that during the ramp up of the Housing Bubble in the early 2000s, they held a lot of agency securities (red) and corporate bonds that also included mortgage backed securities (green). However, in the aftermath of the Housing Bubble, they reduced their exposure to these bond sectors.
Uncertainty = Severe Market Corrections
It is not only the tariffs that hurt, so do the tantrums. Trump changes his mind and disrupts the World economy with tweets or cell phone calls in between golf holes. Tariffs are on, on pause, back on, … and the beat goes on.
4.3%/2.6% — 1 = 65.4%
The news based US Policy Uncertainty Index has risen from 109 before the Election to 335 in February. These values represent the 51st percentile and the 99th percentile, respectively, of a monthly time series going back to 1978.
Rising uncertainty = markets downturns
Businesses don’t like policy uncertainty. In uncertain times, businesses curb their expansion plans and freeze hiring. As a result, unemployment could rise. And, the economy may slow down or even contract. Bruce Kasman, JP Morgan’s Chief Economist, estimates a 40% probability of a US recession in 2025.
The markets are forward looking, and price in all the current and prospective challenges that businesses face. Security analysts revise earnings forecasts downward.
In view of all of the above, markets tank. Indeed, they already have as shown on the graph below.
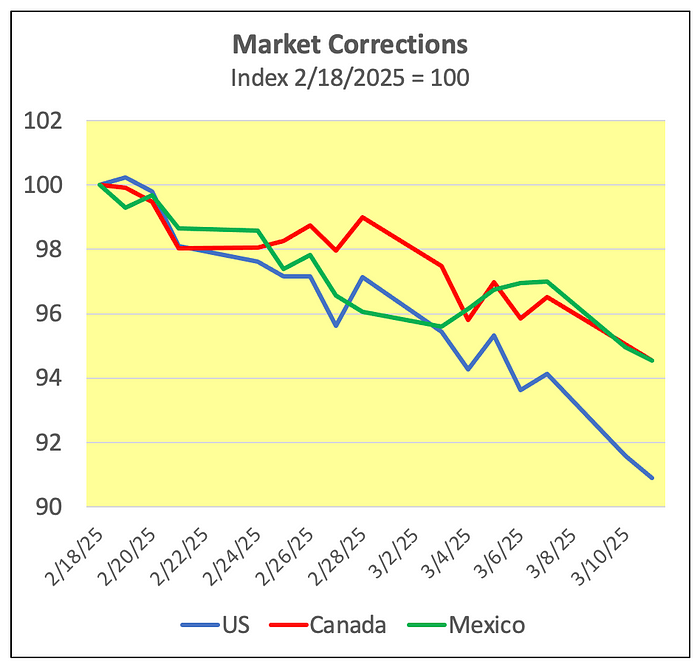
Between February 18 and March 11, 2025, the US S&P 500 dropped by — 9.3% (blue). Meanwhile the Canadian (red) and Mexican (green) market indices have dropped by close to — 6%.
The above is a picture of the US/Canada/Mexico formidable trading block falling apart. One could say: “We miss you Trump 1.0.”
During his first term, Trump would have reacted immediately to such a severe market correction. Now, he does not care about market downturns and even a prospective recession. He remains obsessed by Trade Deficits absent any understanding of the Smile Curve.

Gaetan Lion is an independent researcher with expertise in economics, econometrics, investments, risk management, statistics, and quantitative analysis. His areas of interest include demographics, economics, investments, Climate Change, health care, sports, and politics.