Blog Post < Previous | Next >

California Registrar
The California Props probabilities turned out well
Before boasting let me first reiterate a caveat regarding my probability estimates. They work fine in terms of capturing the "small sample error" uncertainty at the time a poll was conducted. But, my probabilities do not capture:
- The change in opinion between the time a poll is conducted and the elections. This includes the impact of campaigns for or against a Proposition; and
- Structural flaws in how the polling was conducted, including inappropriate weighting of different voting groups.
In view of the above, if my probabilities turned out well in terms of predicting the outcome for the Props, a good element of luck is involved.
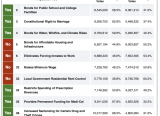
See below the Props results as of November 20. The results are most unlikely to change by the time the votes will be certified in mid December. This is because the vast majority of the votes have already been counted.
And, see in the table below the probabilities of passing I had estimated for these respective Props a month ago. I added a column within my earlier table to indicate if the Prop actually passed or not. If the probabilities were directionally correct, the cell is green. Otherwise, it is orange.
Out of 10 Props only one was directionally erroneous. I estimated Prop 34 of having a 24.6% probability of passing. However, it is most likely to pass. Thus, using my statistical framework I missed on that one. But, all this framework was saying is that if you ran this election four times with similar to identical circumstances, this Prop would pass once. And, this time was the 1 out of 4 that it did pass. I am OK with that.
I also estimated the probabilities for two local measures in Marin County:
a) Mill Valley Measure L, sales tax 1.00%. Probability of passing 97%.
b) Novato Measure M, sales tax 0.75%. Probability of passing 100%.
And, both measures passed handily.
A few of other elections and races I looked at:
a) San Diego Mayoral race. I had the incumbent Mayor Todd Gloria with a 88% probability of winning. He did with a margin of about 10 percentage points.
b) California Senate race. I had Adam Schiff just about certain of winning. And, he did by a very wide margin.
c) Los Angeles Measure A. I estimated it had a 100% probability of passing. And, it did by a wide margin.
The conundrum of polls at the State level vs. Federal level
As reviewed converting the polls for various Props and Measures into probabilities turned out to be very predictive (despite my mentioned upfront caveat). As we know this was not the case at the Federal level. I am not going into all the complications of the Electoral College, I am just focused on the far simpler popular vote percentage. And, the polls were well pretty way off.
Since the end of August, 538 had Harris leading Trump on the popular vote by about 51%/49% or more consistently until Election day. As we know, it did not turn out that way.
Also, baffling is the amount of information underlying the 538 graph above. Since the beginning of August, this graph captures thousands of daily polls. These polls were professionally weighted by some of the best pollsters in the business. And, in the end they were pretty off. Yet, they were well aware of the "shy Trumper" since 2016. They indicated they had corrected for that back then. So, what is going on? Why do even straightforward polls of the popular vote turn out to be so uninformative regarding the ultimate outcome? I gather the challenge consist in forecasting turn out for various voting groups. And, that is a lot easier said than done.
Had I used my simple statistical framework, I probably would have come up with a very high probability that Harris would win the popular vote. And, some of the prediction markets were leaning in that direction too.
Back to our State Props and Local Measures stuff, the PPIC conducted just two polls for the State Props in early September and October. For the local Measures, I used a single poll for each that were several months out of date by Election time. Yet, they all turned out to be very predictive using a basic math framework that is easy to replicate as outlined in an earlier article.
THE END


