
Blog Post < Previous | Next >
Guy
San Diego Mayoral Election Probabilities
The San Diego Mayoral election is contested between Todd Gloria, the incumbent Democrat, and Larry Turner, an Independent, a former Marine and police officer with little Government official experience.
SurveyUSA completed the polls by September 15. Todd Gloria leads with 37%; Larry Turner is at 33%. The remaining are undecided.
I will convert these polls into probability of winning the Mayoral election.
Caveat
The statistical approach I am using has limitations. It is not a crystal ball. It tells you the voter preferences by September 15. It does not tell you how voters will actually vote by November 5. Also polls may have structural flaws associated with inaccuracies whereby their weighting of the various voters' categories is different than the actual one by November 5.
Converting polls into probabilities

The first step is to take the Undecided out of the sample. So, we are left with only likely voters who support Todd Gloria or Larry Turner. When we do that the polls are very close to 53%/47% in Todd Gloria's favor.
The next step consists in calculating the variance and standard deviation of such a poll. Focusing on the figures for Todd Gloria, the calculations are as follows:
Variance & Standard Deviation:
(52.9%(1 - 52.9%))/SQRT(407) = 0.06%
407 is the adjusted sample size once we take out the 30% Undecided
Standard deviation = square root of Variance = 2.5%
Error Margin and 95% Confidence Interval:
Error Margin x 1.96 Standard Deviation: 2.5% x 1.96 = 4.9%
95% Confidence Interval maximum value or 97.5th percentile:
52.9% + 4.9% = 57.7%
95% Confidence Interval minimum value or 2.5th percentile:
The graph below visualizes this 95% Confidence Interval.
The 95% represents the area under the Bell curve (total area = 100%) in between the two vertical dashed red lines. The 95% represents the probability that the accurate value of this poll is between 48.0% and 57.7%. This captures the uncertainty associated with small sample errors.

Final step converting the polls into probabilities
We need to calculate the distance between Todd Gloria polls at 52.9% and the 50% needed to win. And, we measure this distance in number of Standard Deviations.
(52.9%- 50.0%)/2.5% = 1.15 Standard Deviation.
Using the NORMSDIST() function in Excel, we derive that 1.15 Standard Deviation above the 50% threshold to win is associated with an 88% probability of winning.

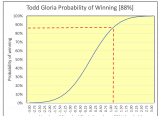
Below we visualize this 88% probability by looking at a probability density function (PDF) graph. The 88% represents the area under the Bell curve to the left of the vertical red dashed line. This line intersects the X-axis at 1.15 Standard Deviation.

We can also visualize this 88% probability by looking at a cumulative distribution function (CDF) graph. And, now this probability is captured on the Y-axis. At 1.15 Standard Deviation above the 50% threshold, this X-coordinate intersects the S Curve at a value of 88% on the Y-axis.

The CDF graph is more intuitive than the PDF one because the height on the Y-axis is easier to interpret than the area under the Bell Curve in the PDF graph.
Next, let's explore what it would take for Larry Turner to win
This poll had 30% Undecided. This is a lot. And, it gives Larry Turner a shot at winning this race. We already know that among the Decided Todd Gloria leads by close to 53%/47%. So, by how much Larry Turner needs to potentially lead among the 30% Undecided to turn this thing around?
So far Todd Gloria leads 37% to 33%. Thus, he leads by 4% among the Decided. To even things out and win Larry Turner needs to lead by the same 4% among the Undecided. Thus, he needs to lead by 17%/13% among the 30% Undecided. When you prorate the 17%/13% among the 30% Undecided, Larry Turner has to lead close to 57%/43% among the Undecided to potentially win.

Below we visualize the interesting contrast between Todd Gloria's lead of close to 53%/47% among Decided vs the necessary lead that Larry Turner needs among the Undecided at close to 57%/43%.
 As shown, Todd Gloria has a material lead over Larry Turner. But, the latter may have a shot at turning things around. However, if voters by November 5th align their votes with the polls as of September 15, Todd Gloria is a heavy favorite going into the November Elections.
What is the probability that Larry Turner can swing the Undecided?
We can use the same framework to figure out the prospective 95% Confidence Interval for Larry Turner among the Undecided.

The table above focuses solely on the sample of the Undecided (174). We assume that the starting poll among the Undecided is similar to the one among the Decided at 47.1%.
Given that the sample is small, the Standard Deviation is much higher at 3.8%. The Error Margin is 7.4%. And, the 95% Confidence Interval ranges from 39.7% to 54.6%. We visualize this 95% Confidence Interval below.

If we assume that the starting poll for the Undecided is 47.1% (same as for Decided), the above indicates that there is less than a 2.5% probability that Larry Turner's poll among Undecided would be greater than 54.6%. That's because both tails of a 95% Confidence Interval represents only 2.5% of the surface under the Bell Curve.
But, Larry Turner has to reach a prospective poll of 56.7% among the Undecided to potentially win. So, his probabilities to reach this higher threshold is less than 2.5%.
We can calculate this probability using 1 - NORMSDIST(2.52). This is because 56.7% is 2.52 Standard Deviations above the starting poll of 47.1%. And, the resulting probability is less than 1%.

Conclusion
As reviewed Todd Gloria is a heavy favorite. To beat him Larry Turner would need one of the following:
- Move the needle on the Decided and get a greater % of votes than he did in the polls. He has about 7 weeks to do that.
- Get lucky, and benefit from a polling error. This luck comes from two components. The first one is a legitimate small sample error. Based on that his luck can be measured as a 12% probability of winning. The second one is that the polling has structural flaws whereby the error is much greater and in his favor.
THE END

Gaetan Lion is an independent researcher with expertise in economics, econometrics, investments, risk management, statistics, and quantitative analysis. His areas of interest include demographics, economics, investments, Climate Change, health care, sports, and politics.