
Blog Post < Previous | Next >
Godbe Research
What is the probability that Novato's 0.75% sales tax Measure M will pass?
In June Godbe Research (GR) conducted polls on Novato's 0.75% sales tax Measure M on the November ballot.
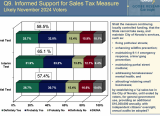
As shown above, GR conducted three polls.
- Initial Test. The likely voters were provided little information about Measure M.
- Interim Test. The voters were provided much more information focused mainly on the benefits of Measure M.
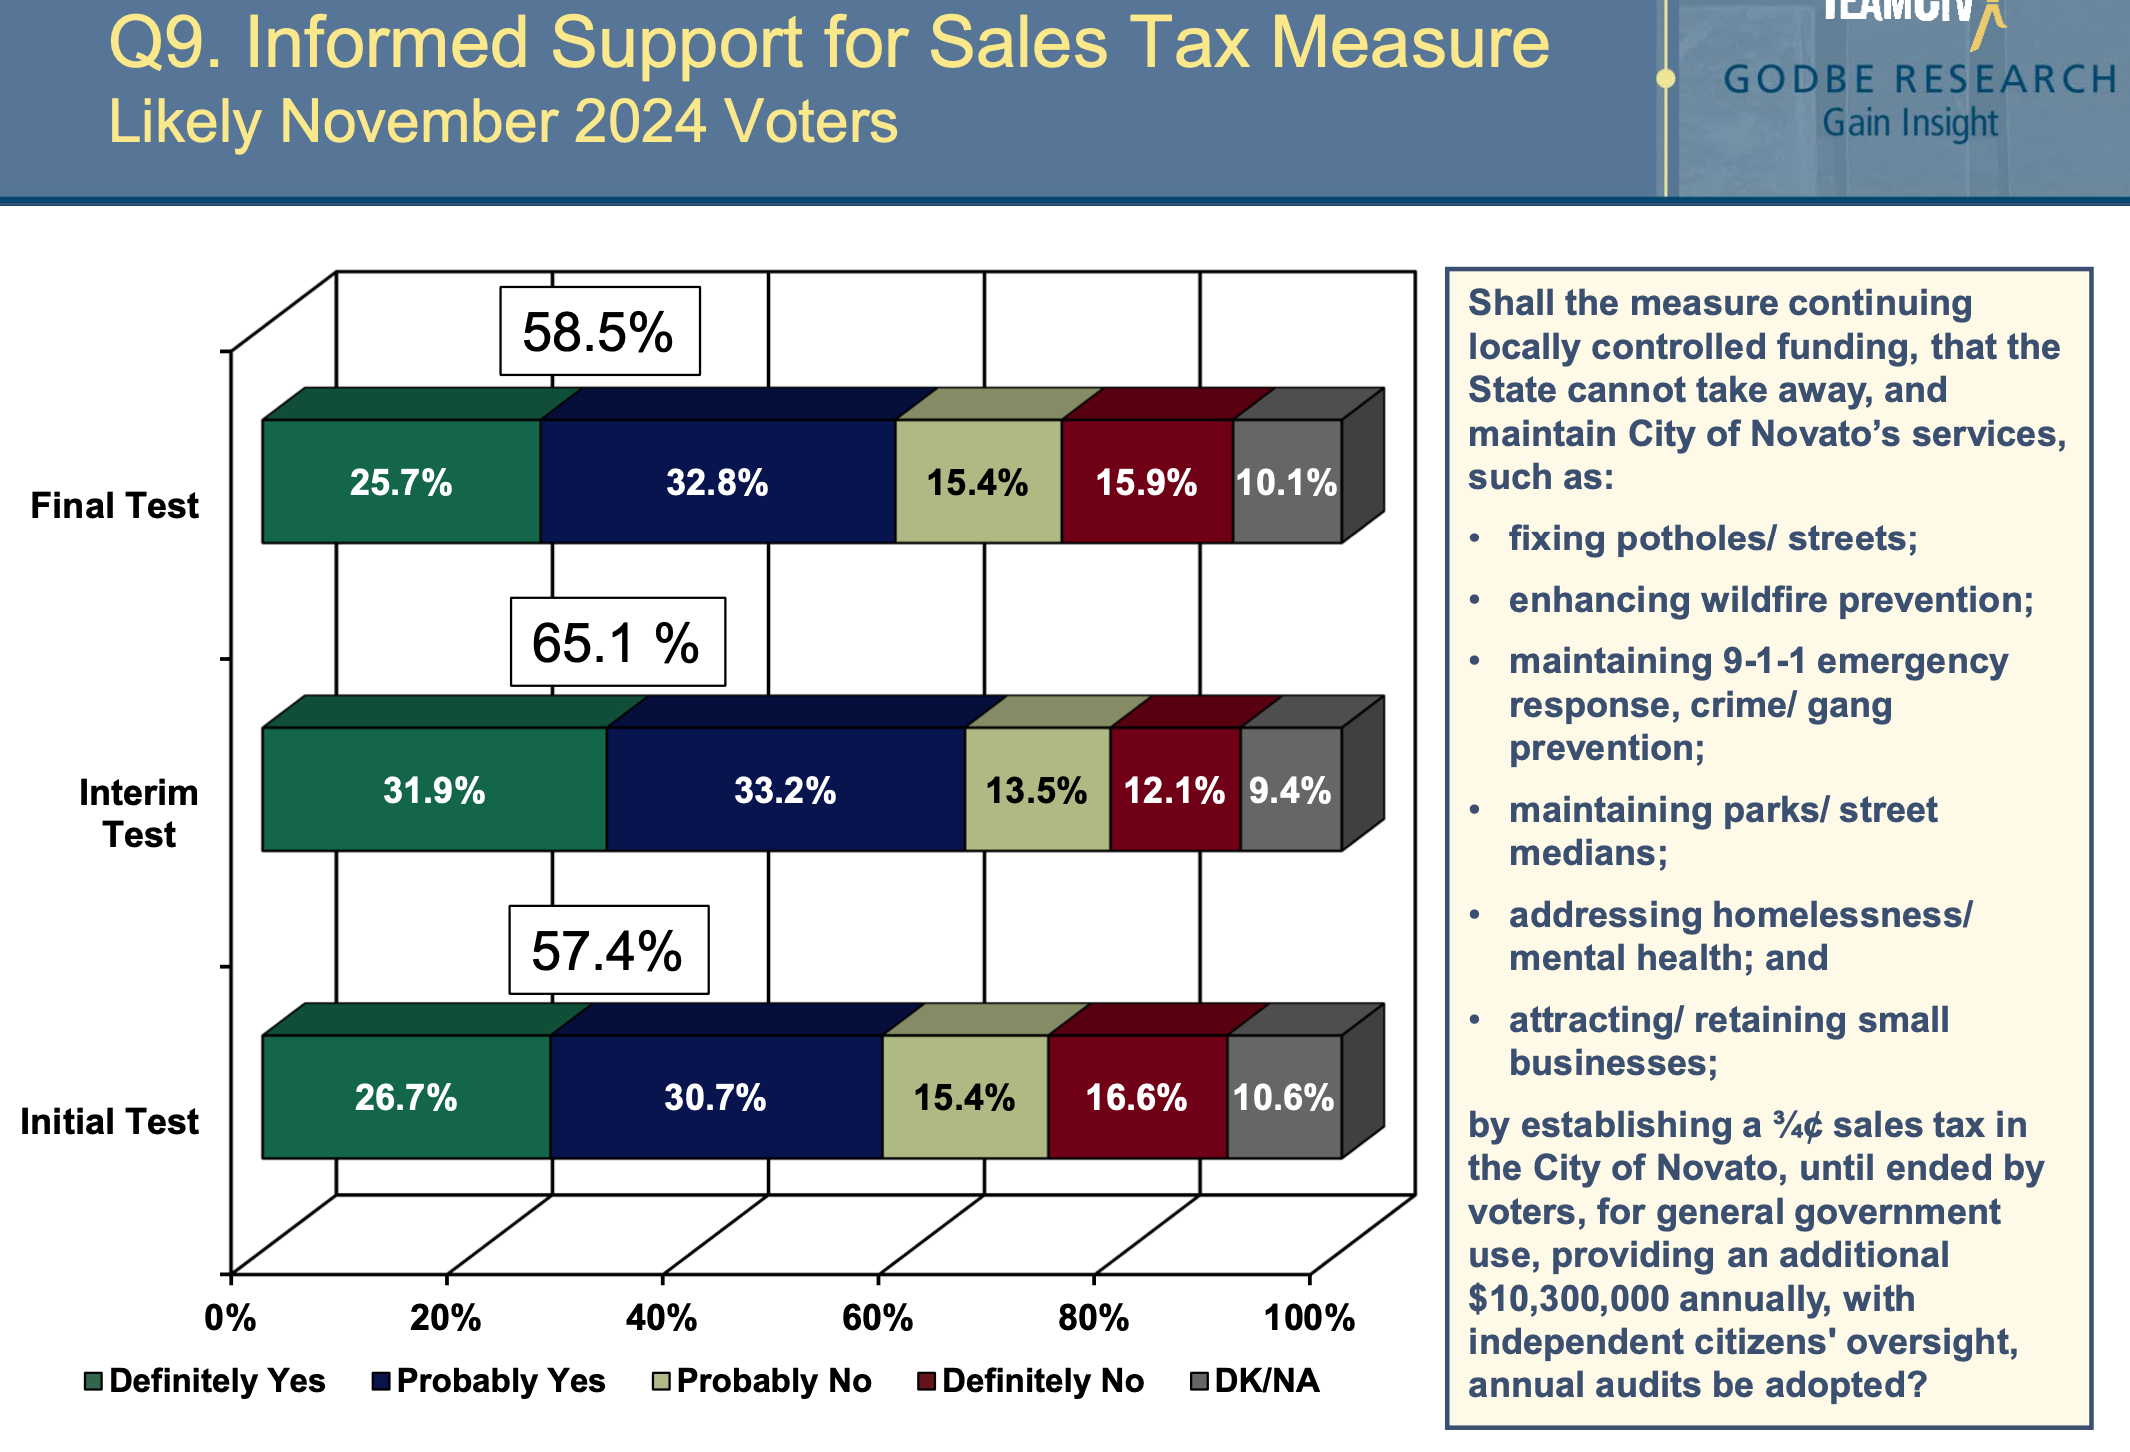
- Final Test. The voters were provided complete information including both benefits and costs.
For more detail on the complete poll survey, check out the attached pdf at the end of this article.
Converting polls into probabilities
We'll work with the most relevant Final Test poll, and pro rated so the Yes and No percentages sum up to 100%.
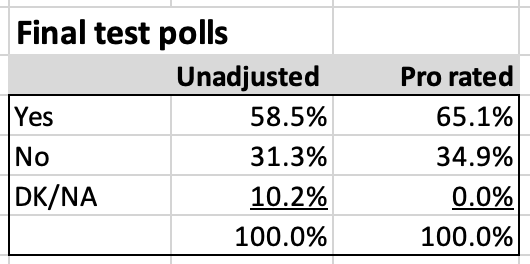
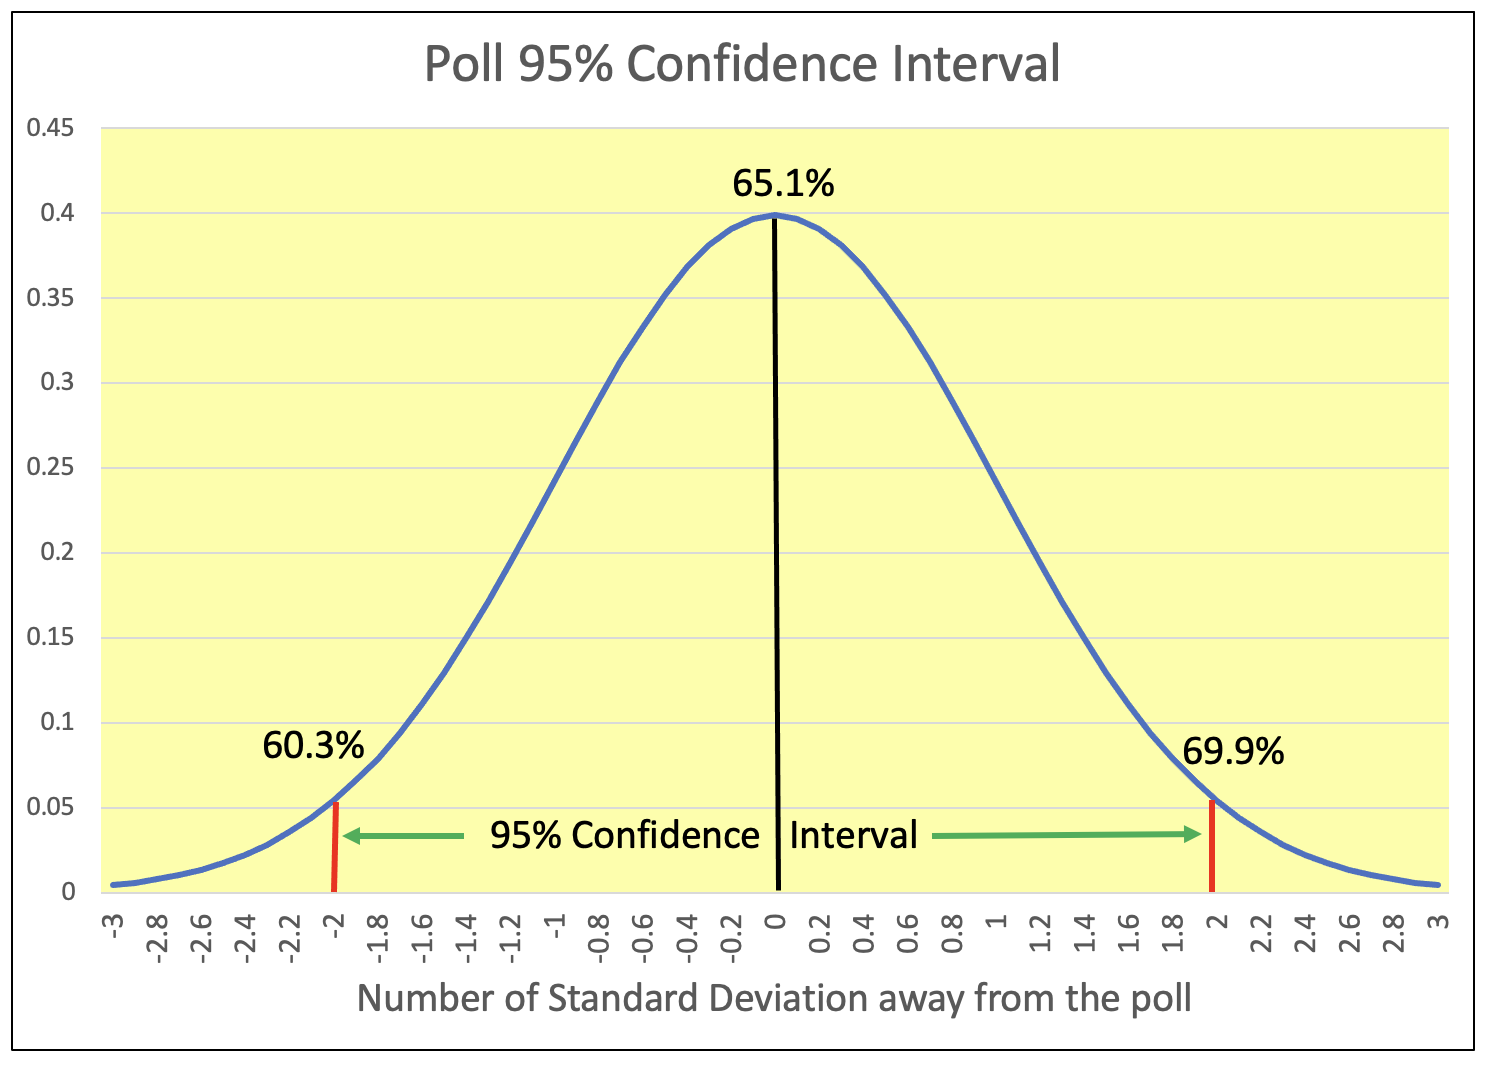
On a pro rated basis, the Final Test poll is associated with a 65.1% Yes. GR disclosed that their sample size was 410 associated with an error margin of + or - 4.81%. Given that, this poll is associated with a 95% confidence interval ranging from 60.3% to 69.9% Yes vote.
Now, let's explore what is the probability of Measure M passing. It needs 50% to pass.
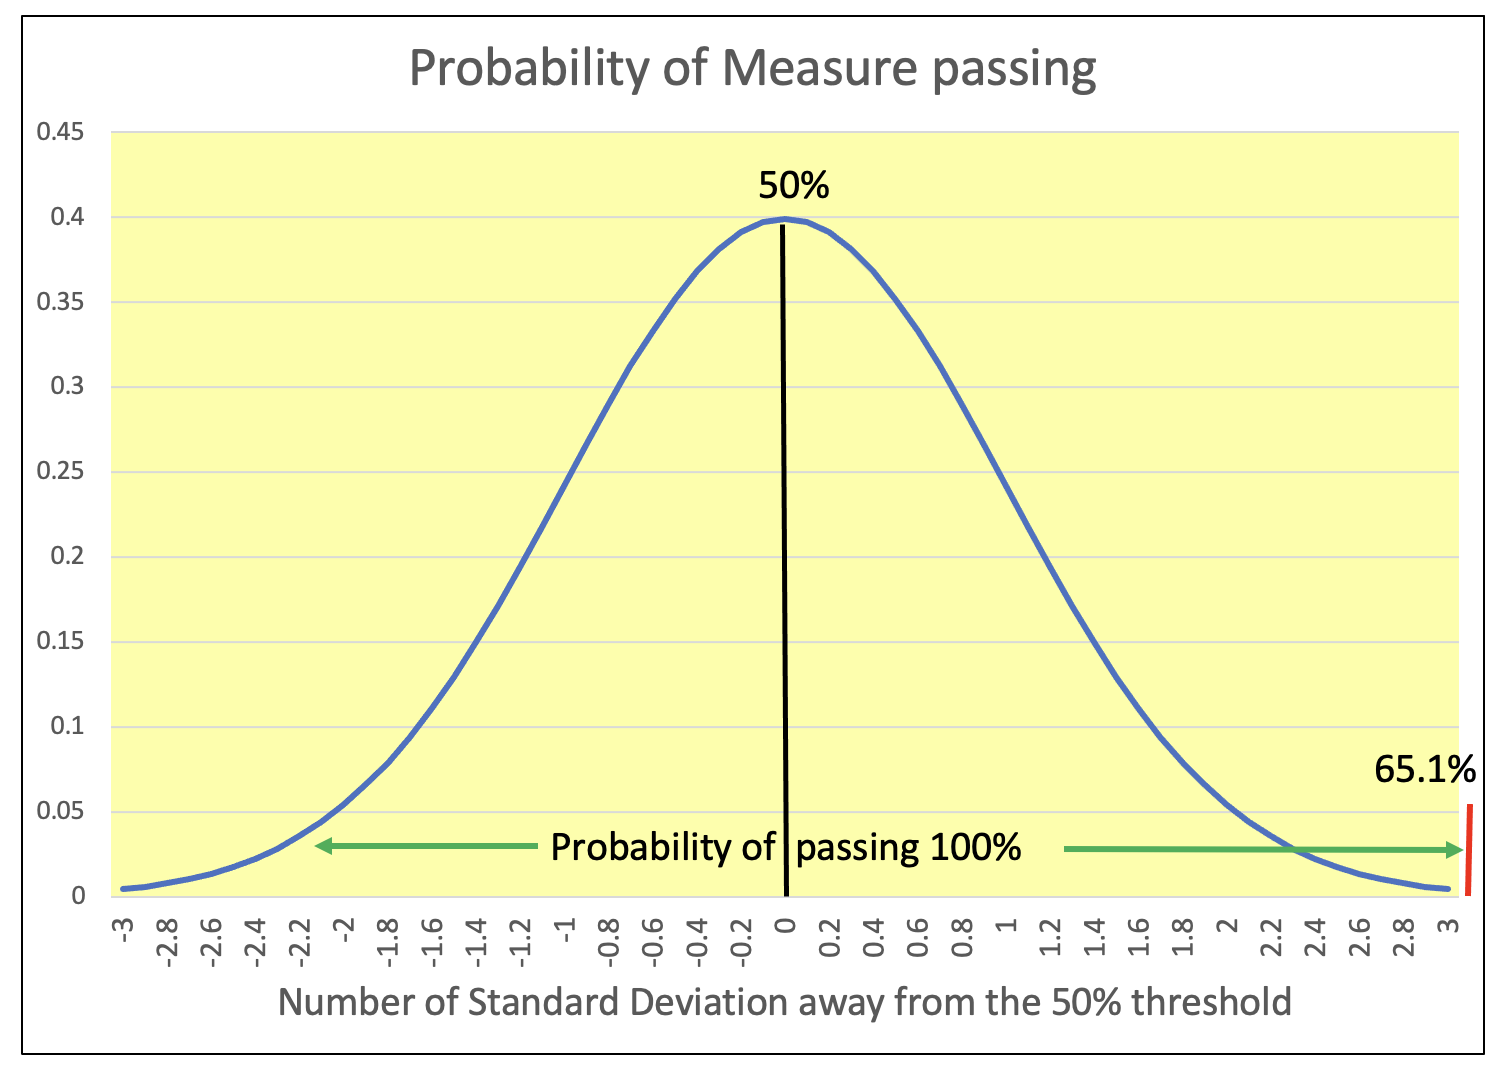
Based on this poll as of June 2024, Measure M has pretty much a 100% probability of passing.
Below I am fleshing out how we got there.
The error margin is 4.81%. This poll's standard deviation is 2.41% equal to half the error margin.
65.1% is about 6 standard deviations above the 50% needed for Measure M to pass.
(65.1% - 50.0%)/2.41% = 6.3 standard deviations
Looking at the surface under a bell curve, with just 3 standard deviations above the 50% threshold you are already at 99.6%. With 6 standard deviations you are even much closer to 100%.
This analysis suggests that if voters had voted in June, Measure M was most likely to pass. This analysis does not factor the campaigns for or against Measure M that may be taking place.
The END
Appendix. Technical consideration
When I disregarded the 10.2% of the 410 sample who did not respond, I should have taken them out of the sample. So, the sample size would be 368.
I should have then recalculate the error margin centered around a Yes poll of 65.1% with a sample of 368 instead of a Yes poll of 58.5% with a sample of 410. I did go through the calculations. And, in the end it did not make much of a difference. The error margin remains pretty much unchanged around 4.8%.
The reason that the error margin remained nearly unchanged is because the following two forces pretty much netted each other out:
a) Reducing the sample size from 410 down to 368 increased the error margin.
b) The Yes poll increasing from 58.5% to 65.1% decreased the error margin.
I wanted to better understand this phenomenon so I developed a data table with scenarios ranging from 50% to 65% for the Yes votes and sample sizes ranging from 300 to 400.
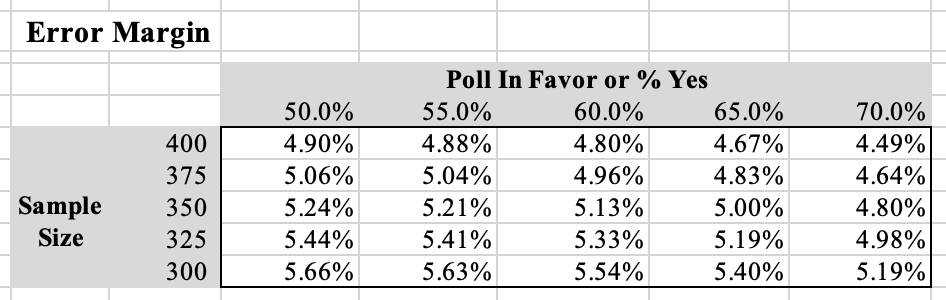
Within the above table you can see as the sample size decreases, the error margin increases (smaller sample = greater uncertainty). However, this increase in error margin due to decreasing sample size is partly countered by increases in % Yes response. It is an interesting phenomenon that I think even few statisticians are familiar with. Most of them are focused on the impact of the sample size alone.

Gaetan Lion is an independent researcher with expertise in economics, econometrics, investments, risk management, statistics, and quantitative analysis. His areas of interest include demographics, economics, investments, Climate Change, health care, sports, and politics.