
Blog Post < Previous | Next >

Guy
What would it take to defeat Mill Valley Measure L and Novato Measure M?
Based on polls, both Measure L and Measure M appear most likely to pass. But, the polls are dated. Measure L's polls were conducted in February. Measure M's polls were conducted in June.
Neither polls capture any information regarding current campaigning. I will explore how many prospective votes shifting from Yes to No are needed to defeat these measures.
Let's start with Mill Valley Measure L.

The starting point is the Yes 58.0%.
Next, we figure out the number of likely voters:
Registered voters x Turnout = Likely voters
10,634 x 91.6% = 9,740
The 91.6% turnout was the one during the 2020 General Election. It is the best proxy for the upcoming one.
Next, we need to figure the % of the prospective votes needed to shift from Yes to No.
(58.0% - 42.0%)/2 = 8%
The 8% shift would cause the Yes and No to both equal 50%.
We translate that into a number of votes to shift from Yes to No.
9,740 x 8% = 779
We add 1 to get a majority. So we end up with: 779 +1 = 780
The 780 figure can be considered as the mean expected scenario based on the polls. But, we could also consider the error margin of + or - 8.5% associated with this poll. This is associated with a 95% confidence interval Yes vote ranging from 49.5% to 66.5%.

Next, we can sensitize the % Yes vote to cover the range of the 95% confidence interval (or the + or - 8.5% error margin), and observe the resulting number of prospective Yes votes to turn into No ones.

As reviewed in an earlier article, based on the February poll Prop L seemed most likely to pass. But, again that poll was back in February. Focusing on the mean expected outcome, it would take only 780 votes to defeat this measure is somewhat humbling. Exploring the uncertainty around this figure, a 95% confidence interval would range from zero to close to 1,600.
Now, let's figure out the situation for Novato Measure M.

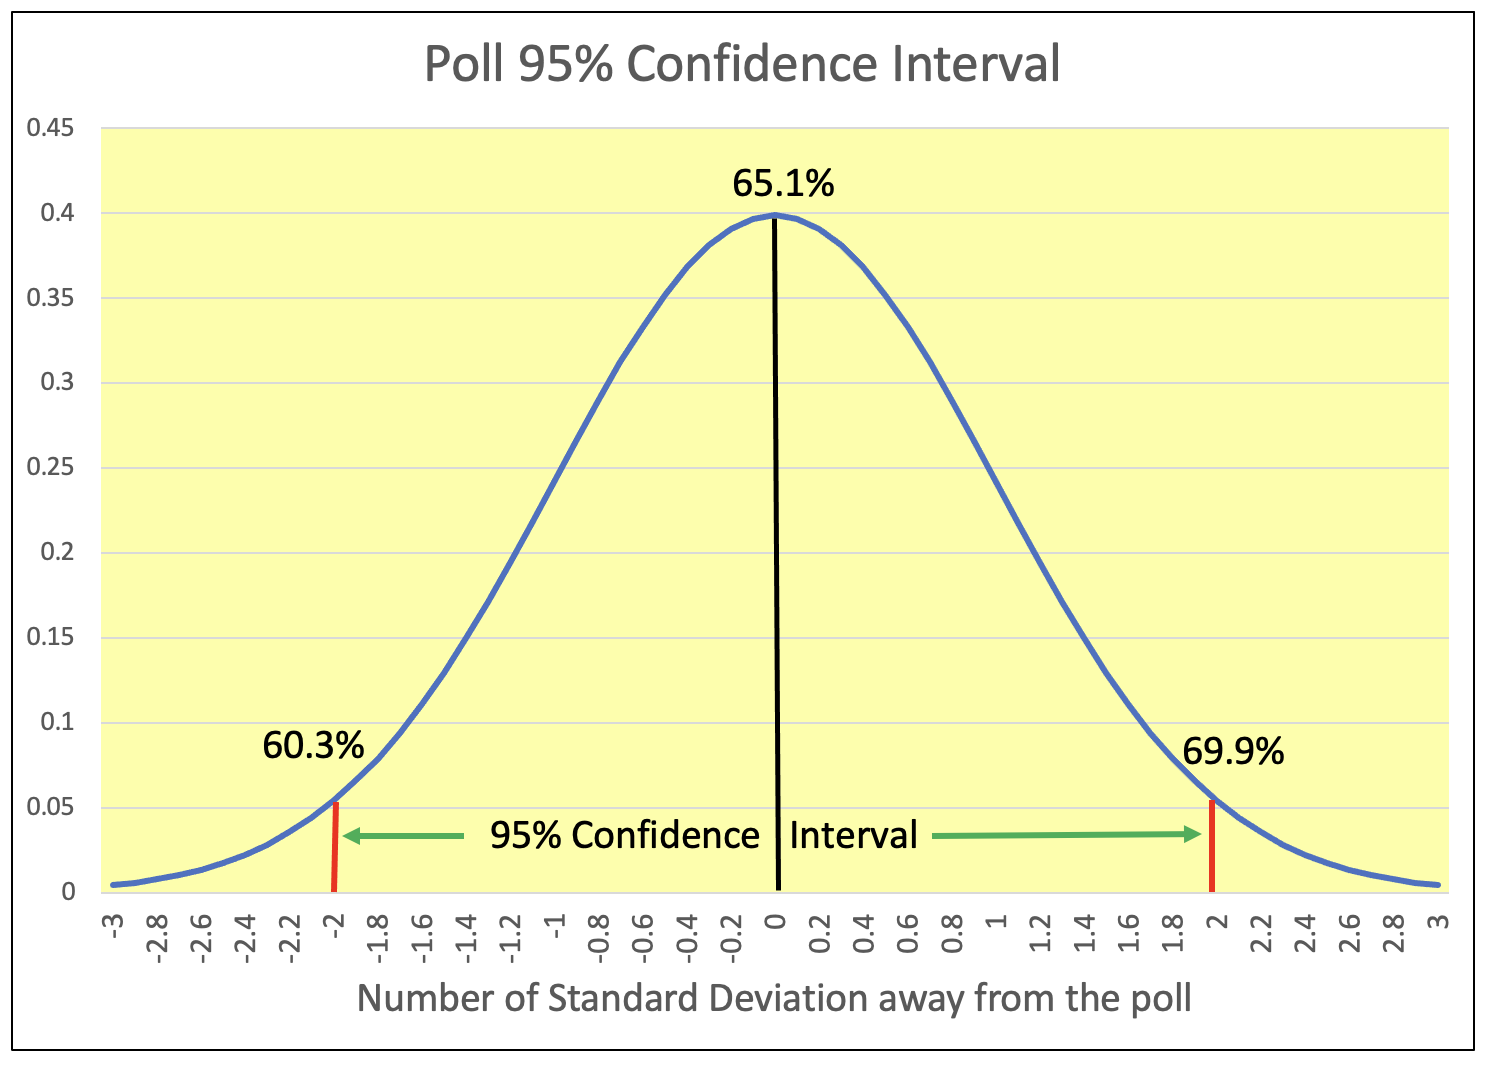
We are doing the same thing except we have to deal with undecided voters. At first, we take them out by pro rating the initial 58.5%/31.3% to 65.1%/34.9%. That's because we need the Yes/No to add up to 100%.
Working through the same methodology, we arrive at 4,579 votes needed to shift from Yes to No.
But, now we have to factor the 10.2% of undecided likely voters. They correspond to 3,092 voters who should be easier to turn into No votes. Only 1,487 prospective Yes votes fall into the not so easy to influence.
This poll was associated with an error margin of + or - 8.5% corresponding to a 95% confidence interval ranging from 60.3% to 69.9%.
Sensitizing the % Yes from 60% to 70%, covering the whole range of the confidence interval, generates the following number of Yes votes to turn into No ones to defeat Prop M.

Again, this gives you a much more nuanced perspective than just relying on the June poll that made Measure M look like a sure thing.
THE END

Gaetan Lion is an independent researcher with expertise in economics, econometrics, investments, risk management, statistics, and quantitative analysis. His areas of interest include demographics, economics, investments, Climate Change, health care, sports, and politics.