
Blog Post < Previous | Next >

US.gov
Social Security Trust Fund Collapse: What Happens when the Money Runs Out
By 2031, Social Security’s main trust fund could be depleted — forcing benefit cuts of 25% or more.
This is related to the US Fiscal Crisis that I covered in an earlier article.
See "The US Fiscal Crisis: When the US pays more for interest on its debt than it pays for Medicare or for Defense, that’s a fiscal crisis all…
Each year, the Social Security Administration (SSA) releases an Annual Report outlining the financial outlook of the Social Security system. This report includes multiple forecasts based on a wide array of demographic, economic, and policy assumptions spanning dozens of pages.
To keep things digestible, I focus on the two key projections:
- The Intermediate Scenario — the SSA’s baseline forecast and most likely outcome
- The High-Cost Scenario — a more pessimistic outlook assuming weaker economic growth and accelerated population aging
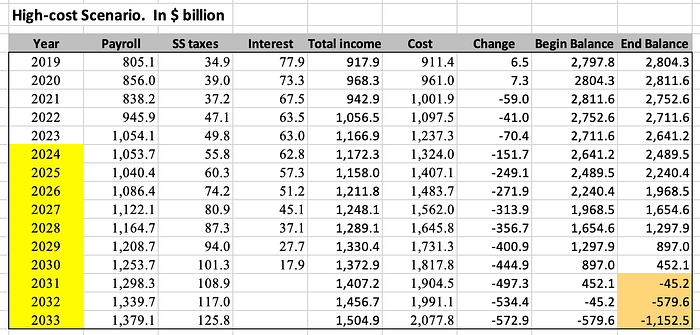
Below is a summary of the Intermediate Scenario. The yellow-highlighted years (2024–2033) represent projections. The orange cell marks the year — 2033 — when the Old-Age and Survivors Insurance (OASI) Trust Fund is projected to be fully depleted.

The table above can be subdivided into three main sections:
- Income — This includes all revenues the SSA collects to fund Social Security benefits. It consists of payroll taxes, taxes on Social Security benefits, and interest earned on the OASI Trust Fund balance.
- Cost — This reflects total benefit payments, primarily to retirees.
- Change in Trust Fund — This is calculated as Income minus Cost. The table also shows the resulting beginning and ending balances of the OASI Trust Fund for each year.
The next table presents the High-Cost Scenario, which assumes slower economic growth and more rapid population aging. Under this less favorable projection, the OASI Trust Fund is fully depleted two years earlier — by 2031, compared to 2033 in the Intermediate Scenario.
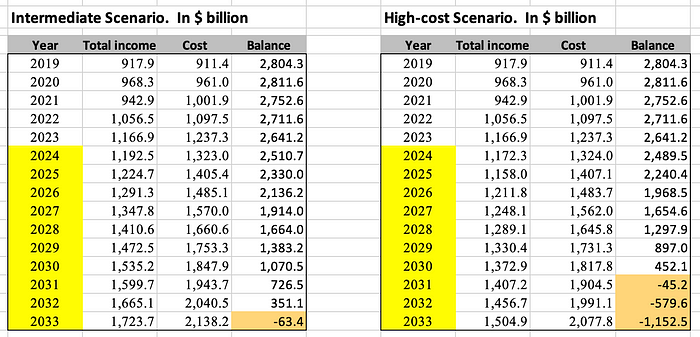
Below is a comparison of the two scenarios. As shown, the OASI Trust Fund is projected to be fully depleted two years earlier in the High-Cost Scenario (2031) than in the Intermediate Scenario (2033).
By law, the trust fund cannot legally operate with a negative balance. However, for illustrative purposes, the charts extend beyond the depletion point to reflect the arithmetic of the system:
Total Income — Cost = Change in Trust Balance
If the resulting balance turns negative, it simply means that projected benefits exceed the fund’s available resources, and the shortfall is carried forward mathematically to show the extent of the funding gap.
The SSA forecasts discussed above do not account for the potential impact of the recently passed One Big Beautiful Bill Act in the House.
Initially, former President Trump pledged to eliminate taxes on Social Security benefits altogether. However, due to the overwhelming budgetary implications, the House ultimately opted to preserve taxation on Social Security benefits — while simultaneously introducing a range of related tax cuts, including:
- An increase in the SALT deduction from $10,000 to $40,000
- An increase in the standard deduction for seniors by $4,000 (single) or $8,000 (couple)
- A broader increase in the standard deduction for all by $1,500 (single) or $3,000 (couple)
The final tax treatment of Social Security remains uncertain, as the bill still faces reconciliation in the Senate. Nevertheless, it’s likely that some of these tax cuts — especially those benefiting seniors — will survive the legislative process.
In light of these developments, I constructed two alternative scenarios assuming a 50% reduction in Social Security tax receipts relative to the SSA’s original forecasts.
The graph below illustrates all four scenarios:
- Blue bars represent the original and reduced-tax versions of the Intermediate Scenario
- Red and orange bars reflect the corresponding High-Cost projections
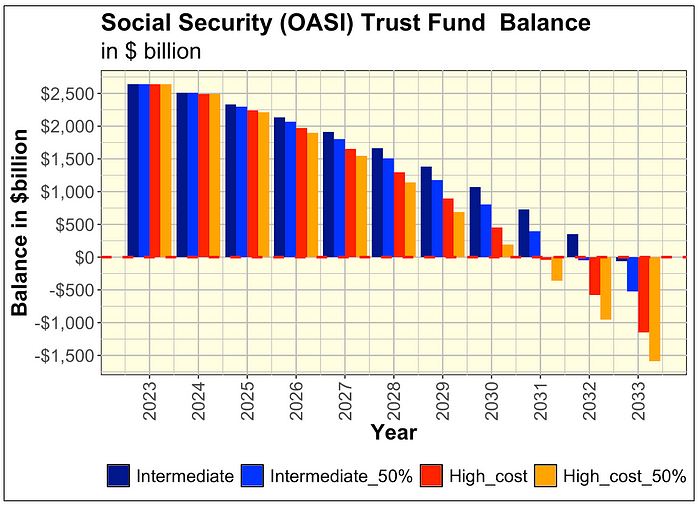
For clarity, let’s split up each scenarios.
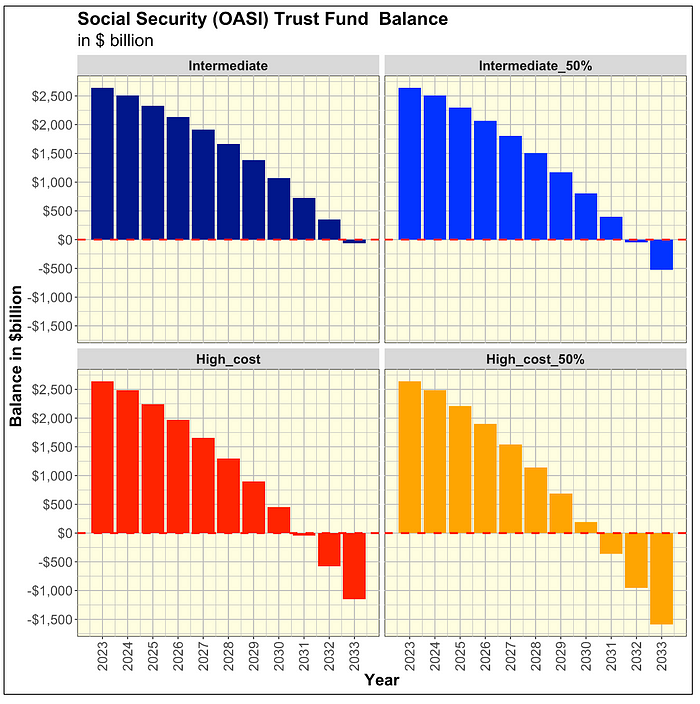
As illustrated above, a 50% reduction in Social Security tax receipts — an increasingly plausible outcome — would accelerate the depletion of the OASI Trust Fund:
- Under the Intermediate Scenario, the fund would run dry by 2032, one year earlier than previously projected.
- Under the High-Cost Scenario, depletion could occur by 2030, also one year sooner.
Once the trust fund is exhausted, Social Security is legally restricted to paying only what it collects through ongoing payroll and benefit-related tax revenues. This would result in significant across-the-board benefit cuts.
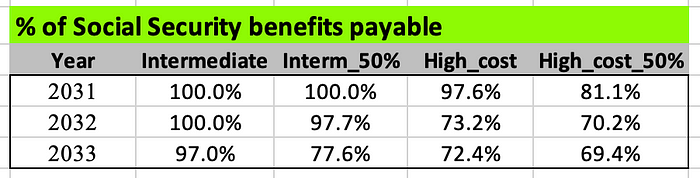
The table below shows the percentage of scheduled benefits the SSA would be able to pay under each of the four scenarios once the trust fund is depleted.
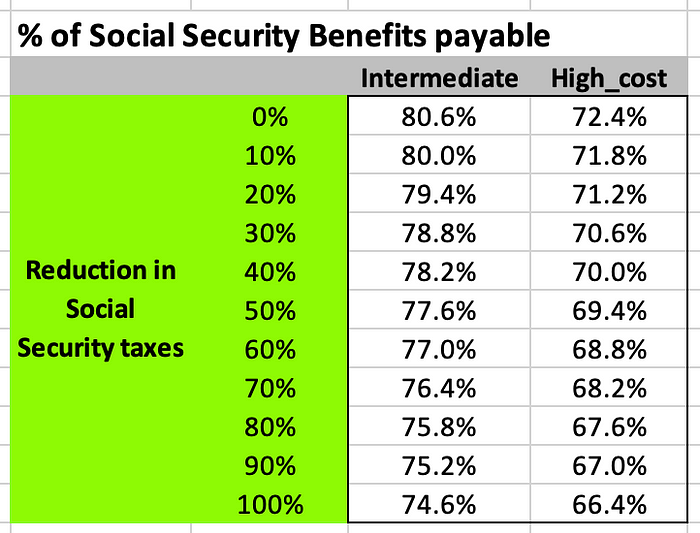
The table below sensitizes the reduction in Social Security taxes from 0% to 100% (or eliminating such taxes entirely) once the OASI Trust fund is fully depleted.
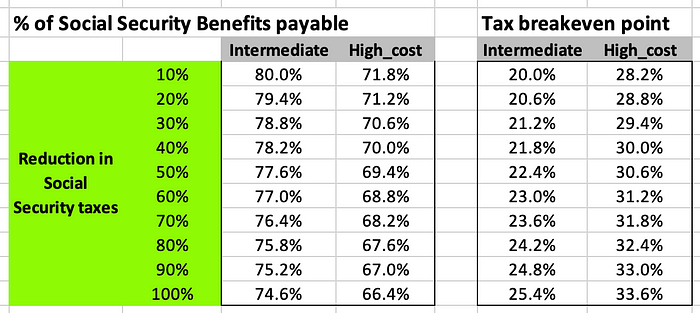
The table below calculates the effective tax rate breakeven point so the after-tax income derived from Social Security is the same.
As an To illustrate the tradeoff between benefit cuts and taxation, consider the following example:
Suppose taxes on Social Security benefits are completely eliminated (a 100% reduction). In that case, under the Intermediate Scenario, the SSA would only be able to pay 74.6% of scheduled benefits.
The effective tax rate breakeven point — the rate at which you’d receive the same after-tax income either way — would be:
100% — 74.6% = 25.4%
In other words, receiving full benefits taxed at an effective rate of 25.4% is financially equivalent to receiving 74.6% of benefits tax-free.
Based on this analysis, the breakeven effective tax rate ranges:
- From 20.0% to 25.4% under the Intermediate Scenario
- From 28.2% to 33.6% under the High-Cost Scenario
It’s important to note that these are effective tax rates, not marginal rates as shown in the official IRS tax bracket tables for 2025 and projected rates for 2031 (assuming a 3% inflation rate). Since most Social Security recipients have relatively modest taxable incomes after deductions, their actual effective tax rates are typically much lower than these breakeven levels — meaning they could be worse off under a no-tax-but-lower-benefit scenario.
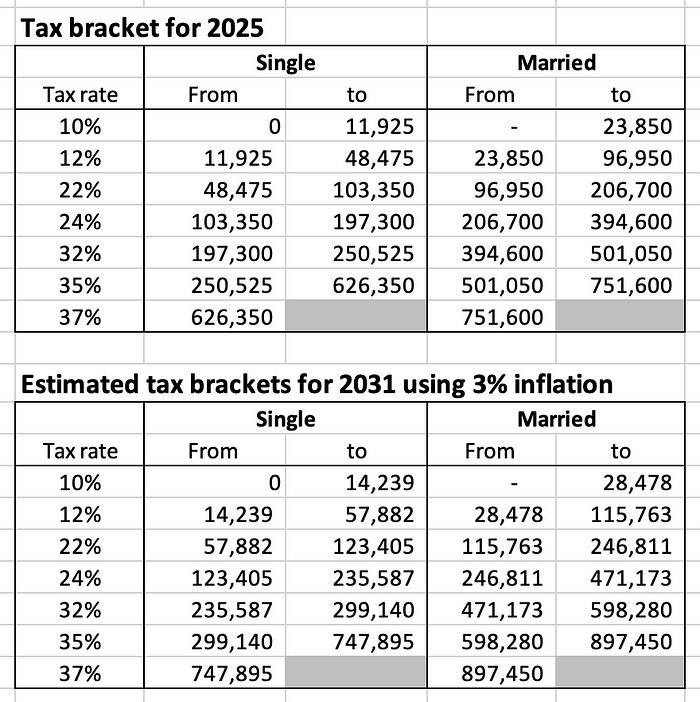
It’s important to recognize that the tables above display marginal tax rates — not effective tax rates — and they apply to taxable income after deductions (whether itemized or standard).
Given that most Social Security recipients have relatively modest taxable income, their actual effective tax rates are well below the breakeven thresholds discussed earlier. As a result, eliminating taxes on benefits would likely leave them worse off, as the benefit cuts would outweigh the tax savings.
In short: most retirees would lose more in reduced benefits than they’d gain from lower taxes.
THE END

Gaetan Lion is an independent researcher with expertise in economics, econometrics, investments, risk management, statistics, and quantitative analysis. His areas of interest include demographics, economics, investments, Climate Change, health care, sports, and politics.