
Blog Post < Previous | Next >

Michael Barnes
The Emperor's New Housing
On May 1, the California Department of Finance Demographics Unit issued its annual press release on population and housing estimates for the state. Unlike other housing reports, DOF measures net housing production, not building permits. It is a different perspective on housing, and it raises some questions. With additional help from recent information on San Francisco, I want to propose two questions:
1) Is California’s housing affordability problem due to a lack of building, as suggested by the Wiener/YIMBY supply-side orthodoxy?
2) Can the state legislature and other elected leaders exercise enough control over the economics of private-sector housing development to reduce rents?
In what follows, I will attempt to persuade the reader that the answer to both these questions is no. Let’s start with the recent DOF data.
THE STATEWIDE NUMBERS ARE NOT CONSISTENT WITH A HOUSING CRISIS

(click on the images to enlarge)
The table above shows the new DOF state population and housing estimates. These are estimates of net housing stock changes, not building permits. The number of building permits issued is used by the state to set goals in the Regional Housing Needs Assessment (RHNA). But not all permitted housing units are constructed, and building those units can take several months (or even years). Permit numbers don’t necessarily reflect the number of newly occupied units, which is why the DOF numbers are valuable.
This DOF data is for Jan. 1 of each year, which in this case is convenient because Jan. 1, 2020, was just a few months before Covid restrictions were put in place. Note that by Jan. 1, 2025, the state population had recovered and was almost back to its pre-Covid in 2000 (short by only 9,122 people). However, during the five-year 2020–25 interval the number of housing units grew by 556,480, so the number of persons per household has steadily declined.
Slightly more than half of new units are single-family, including townhouses. The increase in small 2-4 units apartments, often called missing-middle units, is about one-tenth that of the housing units in larger apartment buildings. Missing-middle housing is still missing. Meanwhile 26,648 Accessory Dwelling Units (ADUs), were added to the single-family housing stock by Jan. 2025. ADUs remain popular, at least in LA County, which in recent years has been responsible for half the ADUs built in the state. But it is not clear that all of them are being used as housing.

At an average of 117,000 net new housing units annually for the last three years, these 2020–25 growth numbers are slightly higher than the average annual figure of 103,000 units for the previous three decades. Housing production grew rapidly in the decade before its peak in 2006, two years before the mortgage crisis and the onset of the Great Recession. The recovery has been slow, and housing growth is back to where it was in the early 1990s. However, the growth numbers are running only about 35-40 percent of the 6th cycle RHNA targets. Even the pro-growth San Francisco Chronicle now seems to understand the RHNA targets, at least for San Francisco, are absurd.
These numbers do not indicate that there is a housing supply crisis in California. They are not consistent with the Wiener/YIMBY supply-side orthodoxy. If there was a continuing crisis, the number of persons per household would be rising with overcrowding, and the vacancy rate would be declining due to a scarcity of housing. Instead, we see that persons per household is declining, indicating a reduction in overcrowding, while the vacancy rate is holding steady. Given all the problems due to Covid, work-from-home, and supply and labor scarcity, the numbers are looking good—the population has recovered, and development has created more than half a million new housing units.
There continues to be serious affordability problems for many California residents, but these problems are not confined to housing. Nor are these problems confined to California. Affordability is a national, and even international, problem. The state legislature is attempting to deal with affordability problems, so far without much success. But when it comes to housing quantity, there is little that Sacramento can do. This is the subject of the next section.
WHY THE LEGISLATURE FAILS TO MEET ITS HOUSING GOALS
In their popular new book, “Abundance,” authors Ezra Klein and Derek Thompson state that “Housing follows the laws of supply and demand.” While that may sound somber and pragmatic to some, it is a cliché that is almost meaningless. It is important to understand why, so let’s get back to some Econ 101 basics:
Question: Under the assumption of perfect competition, where the firm is a price taker that faces a horizonal demand curve, what is the supply curve of the firm?
Answer: The supply curve is the marginal cost curve of the firm above the shutdown point. Now assume a large development firm that can produce hundreds of housing units annually, but knows that to sell more units, it must reduce its prices. In other words, the firm understands that it faces a downward-sloping demand curve, and that it can pick where it wants to operate on that demand curve. The firm has monopoly power and is a price maker, not a price taker.
Question: Under these new assumptions, what is the supply curve of the firm?
Answer: Uh, it’s complicated. The firm will choose to maximize profits by equating marginal costs to marginal revenue, but because the demand curve can shift around and change its shape, which in turn changes the shape of the marginal revenue curve, it’s hard to say what the supply curve would be without imposing some additional restrictions on how the demand curve can change.
Question: Even if you can impose those restrictions, is the supply curve independent of the demand curve as in the case of perfect competition, or is the supply curve a function of the demand curve?
Answer: The supply curve is a function of the demand curve. And of the firm’s marginal cost curve. There isn’t an independent supply curve like in the case of perfect competition.
Question: So when discussing housing, what does it mean to talk about demand and supply?
Answer: Uh, not much.
Here’s a more useful way to think about these economic issues: First, never mind about the supply curve and focus on the demand curve. Every straight, downward sloping demand curve has a sweet spot right in the middle. At that point on the demand curve, total revenue (price multiplied by quantity) is maximized. If you slide down and to the right on the demand curve, quantity sold increases, but not fast enough to offset the decline in price, so total revenue declines. If you go up and to the left on the demand curve, price increases, but not fast enough to offset the decline in quantity.

To confirm this, note that the point where price and quantity both equal 50 maximizes total revenue at 50 x 50 = 2,500. Try any other pair of points along the demand curve like [49,51], [52,48], [60,40], etc. You will quickly discover that the further you get from the [50,50] midpoint, the more total revenue falls.
Now let’s think about profits and costs. Remember that the goal of firms is not to maximize total revenue, but to maximize total profits (TP), where total profits equal total revenue (TR) minus total costs (TC): TP = TR–TC. If a developer moves up and to the left along the demand curve, she will lose TR, but she will also produce less quantity, so her costs will decline as well. If costs decline faster than revenue, profits will rise:
↑TP = ↓TR–↓↓TC.
This means that developers will usually produce at a point that is up and to the left of the demand curve’s sweet spot.
Now here’s where things get interesting. Suppose the state legislature passes several bills to reduce costs to developers by reducing things like impact fees and other charges made by local governments. The reduction of these costs will allow developers to earn higher profits by increasing output and sliding a little further down their demand curve.
However, developers still face other costs like labor, materials, land and interest. Let’s say the state legislature is so concerned about lack of housing construction that it passes a bill to completely subsidize all costs. Facing zero costs, how much will the developers choose to produce? Will they go wild, slide way down the demand curve and produce a lot of housing? No—they will choose to produce at the sweet spot in the middle of the demand curve.
If there are no costs, the way to maximize profits is simply to maximize revenue. And developers do that by producing at the midpoint sweet spot. This explains why the legislature’s attempts to boost housing development by handing perks to developers has not been a successful strategy. Major giveaways to developers probably won’t cause them to move very far down their demand curves, and certainly not below the midpoint.
One caveat: Maximizing profits doesn’t always mean that profits will be positive. If costs are higher than revenues, then profits will be negative. In this case the firm is minimizing losses. But if losses continue for too long, the firm will shut down and produce zero housing. Only after some combination of rising revenues and falling costs restores profitability will housing production restart.
So far, we have addressed the issue of housing production using the basic short-run, static neoclassical analysis that is taught in Econ 101. But to fully understand housing production, we need to expand our horizons to include the long-run, dynamic analysis that is more common in business school finance courses. We need to better understand how developers decide when to build over the course of many years.
Automobile producers like GM or Toyota must keep in stock the variety of parts they need to build cars. But car makers don’t stockpile vast qualities of spare parts and keep them as speculative assets. Just the opposite—Toyota was famous pioneering just-in-time inventories to save money by minimizing the number of parts in stock (although this was difficult during Covid because of supply shocks).
However, this is not how developers treat land. Land is an asset, and developers are portfolio managers who own a variety of assets, including land, cash and other financial instruments, planned and permitted projects awaiting the start of construction, and completed projects ready for marketing and occupancy.
To understand why and when housing developers choose to build, we would need to know their expected long-term trajectories for inflation, interest rates, land prices, labor and materials costs, population and income growth. Also keep in mind that development is irreversible. If a developer chooses an apartment project’s density and height based on her best predictions of costs and rental income at the start of construction, by the time the project is completed years later, her predictions may no longer be accurate.
But at that point she is stuck. She can’t disassemble the project, sell of all the girders and wiring and plumbing, and start all over again. Developers cope with the unpredictable nature of their work by being cautious and inserting risk premiums into their profit margins. In practice this means going slow and steady, even if that means occasionally undershooting rising demand to keep rents high enough to maintain profitability in the face of uncertainties. Sometimes developers overshoot, too. Austin, TX, is a good example. When that happens, developers typically stop building.
Public officials sometimes naively assume they can stimulate housing development today by streamlining approval processes, shifting infrastructure costs onto local government, and other techniques that lower developer costs. But for developers these moves don’t necessarily change the intertemporal equilibrium, which determines their optimal timeline for building. They may be thankful for the cost reductions, but they may still prefer to start building in the future, not now. The cost savings from building now also will save money if they instead build in the future, so this policy won’t necessarily stimulate building today.
Developers will often win approvals for large projects but then dribble out the new housing units over the course of many years. This strategy is called staging or phasing. An example appeared in the Oct. 30, 2024 online edition of SF Gate:
“The new neighborhood, which has been planned for decades, could eventually include more than 15,000 new homes. …Dubbed “Silverwood,” the community will be a joint effort of developers Lennar, Watt Capital Developers, Woodside Homes, Richmond American Homes and K. Hovnanian Homes. …Approximately 300 properties are expected to be completed next year. …Construction will increase slightly, with 500 homes projected for 2026 and 700 homes annually thereafter.”
At 700 housing units per year, it will take more than 20 years to complete the 15,000-unit project.
Our elected leaders in Sacramento seem to be content continuing to throw perks at developers, hoping they will build more now. But after eight years since the passage of the 15-housing bill package of 2017, it is becoming clear that housing development continues at a steady but slow pace regardless of the efforts of the legislature.
SAN FRANCISCO IS AN INTERESTING CASE STUDY
San Francisco is the home of both State Senator Wiener and the YIMBY movement. It is a good example of the issues we have been discussing. The DOF data on San Francisco housing and population trends are here:

San Francisco’s population has not fully recovered to its pre-Covid levels, and currently stands at 96.4 percent of its Jan. 1, 2020 peak. Yet the city added 15,397 housing units during this five-year period, driving down the persons per household figure from 2.26 to 2.10. As with the statewide data, these figures are not consistent with a physical housing shortage.
All this was made more real by a housing forum at Manny’s, a café and community event space in the city’s Mission District. On Thursday, Apr. 3, the forum featured Rich Hillis, San Francisco’s Director of Planning. Hillis discussed the city’s plan to upzone certain neighborhoods to meet the 6th cycle RHNA requirements. Hillis pointed out that San Francisco’s housing development pipeline contains 73,776 units with 56,123 already approved, and 34,531 units remaining in large multi-phased projects.
During the discussion, a young male voiced asked a question about what could be done to get developers to build those 34,531 entitled units. That is precisely the right question, but Hillis didn’t have a good answer because when developers choose to build is largely beyond the control of local and state governments.
The housing development pipeline is backed up beyond the point where the city has issued the necessary approvals and entitlements. City policies might be constraints, but they are not the binding constraints in this case. The binding constraints are the developers’ phasing strategies.
Based on the numbers and concepts in the DOF table above for San Francisco, let’s explore the relationship between housing supply and rents. Adding more housing can affect population, the vacancy rate, or persons per household, or some combination of all of them.
Each of these in turn will affect rents differently:
Example 1: Developers add housing units, but due to lack of job growth, the population does not change. Residents are content with their current housing situations and are not seeking to go through with the hassle and expense of moving. In this case, population remains stable, but the vacancy rate rises and stays higher. The persons per household numbers remain stable because vacant housing units are not included in the calculation. Rents will fall as property owners offer incentives to attract new tenants.
Example 2: Developers add housing units, but due to lack of job growth, the population does not change. However, unlike the first example, residents take advantage of the new units to live with fewer housemates. People who had been living with their parents find their own places. The residents spread out the occupy the new housing units. The population remains stable, the vacancy rate is unchanged, and the persons per household number declines. Rents remain stable.
Example 3: Developers add housing units in response to job growth. The population rises proportionately as new workers move in. The vacancy rate is unchanged. If the newcomers have similar wages to the existing population, rents will not change. If the newcomers have higher incomes than the existing population, rents will rise. If population growth is higher than housing growth, vacancy rates will fall and rents will rise.
Example 3 tells the long-term story of San Francisco’s housing market, going back to the Twitter Tax breaks of 2012. With the stalling of the tech sector and tech-sector employment, Example 2 now better describes the San Francisco housing market. Something like Example 1 happened during Covid with work-from-home, but in that situation, the rise in the vacancy rate was due to the decline in population.
That local government foot-dragging causes delays in construction is an article of faith among YIMBYs, but an interesting alternative view is here. In addition, a recent San Francisco Federal Reserve Bank and National Bureau of Economic Research (NBER) paper (more here and here) suggests local governments aren’t the culprits.
From the paper’s abstract:
The standard view of housing markets holds that the flexibility of local housing supply–shaped by factors like geography and regulation–strongly affects the response of house prices, house quantities and population to rising housing demand. However, from 2000 to 2020, we find that higher income growth predicts the same growth in house prices, housing quantity, and population regardless of a city's estimated housing supply elasticity. …Using a general demand-and-supply framework, we show that our findings imply that constrained housing supply is relatively unimportant in explaining differences in rising house prices among U.S. cities. These results challenge the prevailing view of local housing and labor markets and suggest that easing housing supply constraints may not yield the anticipated improvements in housing affordability.
The article’s finding that housing affordability problems are driven by income inequality was supported by this article and the work of Aziz Sunderji, a real-estate market analyst and expert in data-visualization techniques:
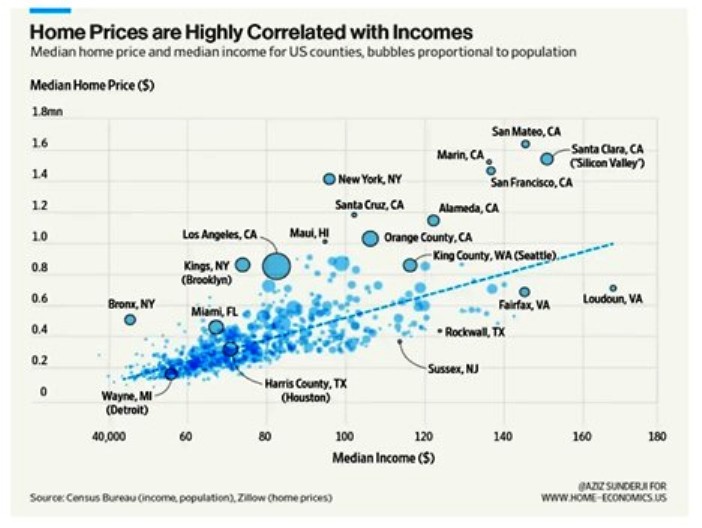
According to Sunderji’s analysis:
“San Francisco (and nearby Alameda, Marin, and San Mateo counties), Seattle, New York, Los Angeles, and Silicon Valley (including nearby-ish Santa Cruz) all lie above the trendline: prices there are more expensive than what you’d think, based on local incomes.
“To be clear: in all of these places, incomes are very high. It’s just that home prices are absolutely exorbitant. I would imagine extreme wealth, a deeply unequal distribution of income, and understated incomes due to tax sheltering explain some of this.
“But loosening regulation to help unlock supply will only help on the margins. It constitutes rearranging the deck chairs while the Titanic is sinking.
“If a shocking number of people fall below some reasonable threshold of what we deem fair to spend on housing—whether that’s 30% or 50%, or some other figure—then that is a problem primarily to do with the unequal distribution of incomes, not of regulation and housing supply.”
YIMBYs cite Houston as an example of a city with inexpensive housing due to the lack of zoning and other land-use regulations. In 2016, Houston Chronicle reporter Lydia DePillas (now at the New York Times) discussed this issue:
“For many years, Houston has been Exhibit A for people looking for evidence that cutting away land-use red tape leads to inclusivity and broad-based economic growth. …But it's also important to remember one very important thing about the geography of affordable cities: They tend to be much less dense already. Plotting median rents (as collected by Zillow) against the number of people per square mile shows a pretty strong correlation between the two. …But building in already-dense places is inherently harder than places like Houston that still have big unbuilt lots all over downtown.”
In the graph above, Houston, TX (Harris County), lies on the regression line — home prices are not cheap there compared to incomes. Census Bureau data tells a similar story for renters. According to Census Bureau definitions, a renter household is cost burdened if total rental expenses, including utilities, are more than 30 percent of household gross income.
The table below shows the percentage of renter households that are cost burdened:
USA total:50.4 percent
USA urban:51.2 percent
Harris County, TX 53.0 percent
San Francisco, CA38.0 percent
San Francisco has an unusually low rate of rent burden due to high incomes for tech and other workers, and rent control and other renter protections for lower-income residents. Houston is less affordable than San Francisco and the USA as a whole.
Nor is San Francisco’s housing stock growth much different than that of New York City. This previously mentioned SF Chronicle article notes that San Francisco’s RHNA housing target of 82,000 units is similar to that of New York City even though New York city has about ten times the population. In the article, Corey Smith, Executive Director of the YIMBY-aligned Housing Action Coalition, said the New York/San Francisco comparison “is not quite apples to apples:”
“The amount of catch-up we need to play in California and San Francisco is not the same as New York. Our 82,000 number is because we are so far behind, whereas New York has produced more housing over the last 40 years relative to population growth.”
An hour or two of research shows that Smith’s statement is incorrect, at least for the last 30 years (data sources available on request):

Vacancy rates were similar in both cities. Also note that both cities have significant suburban neighborhoods. In New York City they are located on Staten Island and in outer Queens. New York City has a higher percentage of its population in the under-24 age categories, while San Francisco has a higher percentage in the 25-54 age categories. Both have a similar share of their population in the 55 and older age categories.
MAYOR LURIE’S PLANS—FAMILY HOUSING OR SORE THUMBS?
San Francisco’s cool winds are already blowing against the city’s new mayor. Rich Hillis, the city’s planning director, has resigned (here and here). Whether Hillis was forced out, or whether he chose to walk away, makes little difference. It is a bad omen. The city’s new inexperienced mayor now has one less experienced person to rely on. Mayor Lurie appears to be following the path of a previous mayor, Gavin Newsom, who also overpromised about how much housing development he could deliver once he became the governor.
In his statement on his Family Zoning Plan, the mayor said, “San Francisco should be a city with space for more families, more workers, and more dreams.” I suspect only one of these wishes will come true — the one about dreams.
The reality the mayor faces is messy. First, the state’s RHNA targets are wildly unrealistic. They will not be achieved. This is no accident—the targets were designed to be unachievable, thanks to Senator Wiener and his 2018 bill, SB 828. The goal was to guarantee the triggering of the state’s Streamlined Ministerial Approval Process (SMAP). Because of this process San Francisco’s residents are losing the ability to help shape their city.
Second, the mayor’s upzoning plan (let’s call it what it is) is not a form of eminent domain. Upzoning cannot force landowners and developers to do anything. That’s what property rights mean—in this case, the right to do nothing. And why should developers want to build? The next economic boom has yet to appear on the horizon. AI will be a substitute for some job skills, and it will complement others. At this point it’s hard to say whether the net result will be job loss or job creation for San Francisco.
Third, Lurie dreams that new housing will be for families. But a young couple with a newborn requires a two-bedroom apartment. An older couple with two teenage kids and a work-from-home office requires four bedrooms. According to census data, less than 10 percent of the city’s housing units have four or more bedrooms, and that includes both apartments and houses. Does the new mayor dream he has the authority to force developers to build three- and four-bedroom apartments? If so, I think he will be disappointed.
As David Thompson, a local political activist and astute observer of the city politics pointed out to me,
“I agree that the upzoning that's being proposed is unnecessary. However, I don't think there is much chance of stopping it. I also don't think there's much chance it is going to result in significantly more housing than if zoning remained unchanged. I do think it will result in many new buildings that are simply out of scale—sticking up like sore thumbs—in the neighborhoods that must endure them. They will include the bare minimum of affordable units. This, I'm afraid, will be the legacy of this latest effort to expand housing.”
But for now Mayor Lurie, a new Planning Director and all the other new mayoral appointees can go on dreaming. Dreaming is free.

Michael Barnes is a former member of the Albany Unified School District Board and served on the Albany City Council from 2012 to 2020. He also served on regional boards and commissions, including, the Association of Bay Area Governments-East Bay (ABAG) and the League of California Cities (as alternate). Michael was appointed to the City of Albany's Transportation Commission in 2022 and served as the science editor for the UC Berkeley College of Chemistry for 11 years, until he retired.