
Blog Post < Previous | Next >

G. Lion
The History of the World on an S curve
The past two centuries have been extraordinary as the industrial revolution triggered unprecedented growth. But, this growth period is almost done.
To capture the history of the world’s growth, you need to remember just one date: the industrial revolution around 1800.
If you look at time series graphs of the global population, GDP, or GDP per capita; they all look the same as shown below.
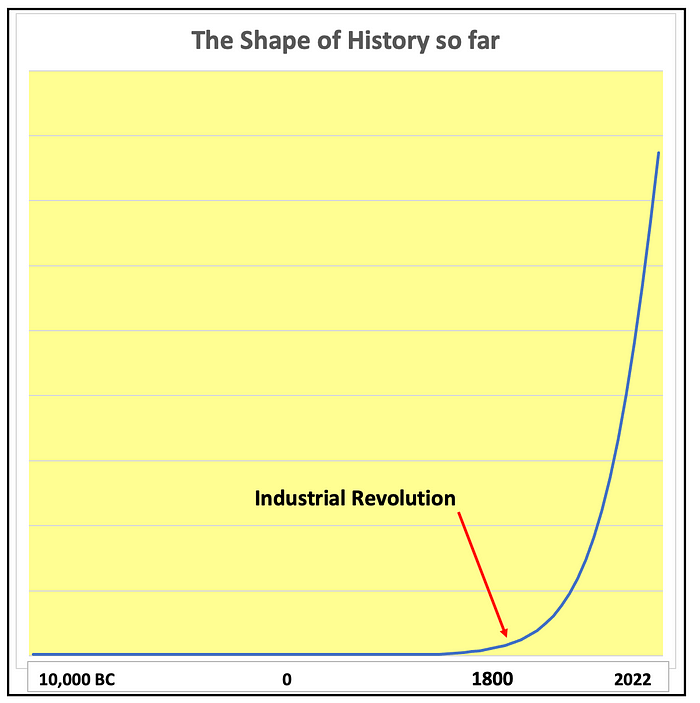
The history of the world‘s growth is associated with a very long and flat left tail since early times associated with extremely slow growth. Then around 1800, the industrial revolution triggered an explosive growth until the present.
Earlier inventions, although most impressive from a cognitive standpoint, did not have much of an impact on the trajectory of the history of the world’s growth. These include the development of agriculture (11,000 BC), cities (8,000 BC), writing (3,300 BC), geometry (~ 500 BC), wheelbarrow (407 BC), algebra (~ 300 BC), printing press (1439), and newspaper (1605)… just to mention a few of such critical inventions. These inventions contributed to the foundation of our modern civilization. They also contributed to the body of knowledge that facilitated a new generation of inventions during the industrial revolution.
It is only with the implementation of the industrial revolution inventions that growth just took off.
These inventions included the steam engine (1765), steam locomotive (1804), and internal combustion engine (1807). These inventions implemented the mechanization of agriculture, industry and transportation,
Interestingly, all the succeeding inventions of the information age, biotechnology revolution, etc. have not left much of a footprint on the trajectory of the world’s growth. The industrial revolution launched the growth rocket in the early 1800s, and it has kept flying nearly straight up ever since.
The next 200 years will be very different from the past 200. This explosive growth can’t continue.
Between 1800 and 2021, the world’s population increased from just under one billion to eight billion. The annual growth rate was 0.95%. To maintain this growth rate, the world’s population would reach 53 billion within the next 200 years. This is certainly not going to happen.
Economic growth also runs into the constraint of annual growth compounding. Between 1870 and 2015, the world’s real GDP per capita rose from $1,400 to $15,000 resulting in an annual growth rate of 1.65%. Maintaining this growth rate over the next 200 years would result in a real GDP per capita of $395,121. This is another impossible prospect.
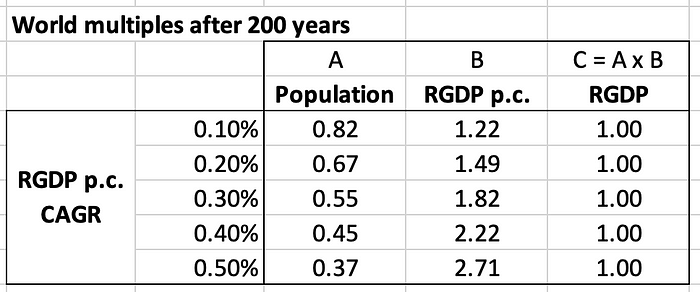
Let’s explore the constraints of compounded growth rates a bit further. The table below discloses scenarios with different levels of population and economic growth. If population and real GDP per capita could keep increasing at their historical rates since the industrial revolution (0.94% and 1.65%, respectively colored in yellow), the world economy would be 171 greater in 2221 than it is today! This is clearly impossible.
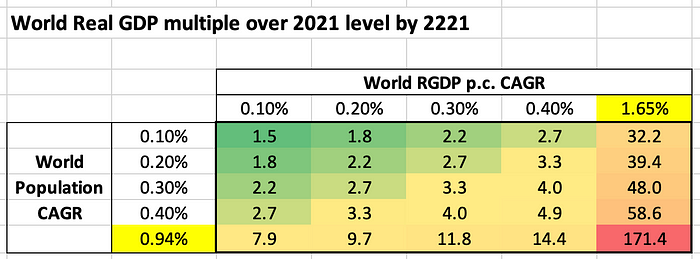
The table shows that even very small growth rates would still result in the world economy being between substantially to absurdly larger than it is currently. The color coding represents progressively unlikely scenarios from possible (deep green) to absurd (red). Just a 0.10% growth rate in population and real GDP p.c. would result in the world economy being 50% larger than currently by 2221. If you consider a 0.40% growth rate, the world economy would be close to five times larger than nowadays!
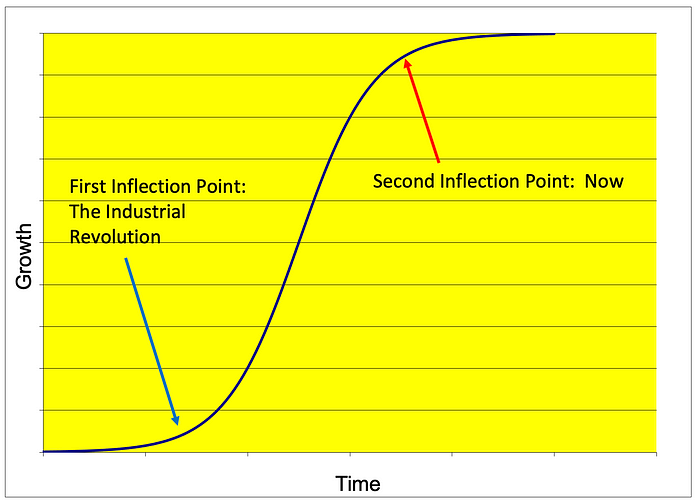
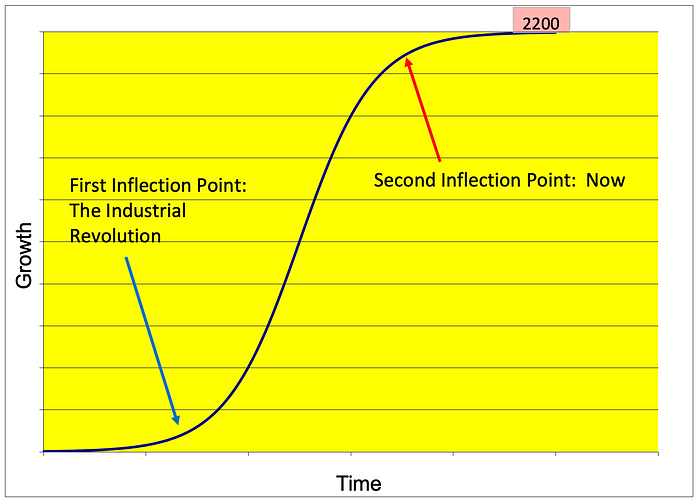
So, what is likely to happen? Well, we are currently drawing an S curve.
And, we are just at the start of an S curve second inflection point when the exponential growth flattens and converges towards a near zero-growth rate.
There are plenty of empirical evidences that the world’s mentioned growth is slowing down, and has been doing so for already a few decades. I conducted a detailed study on this topic about a year ago that you can read at the following link.
https://www.researchgate.net/publication/364324897_Next_200_Years
In this article I will streamline my analysis by concentrating on the relevant history and prospect of only four countries: China, India, Japan, and the US. Together these four countries account for over 40% of the world’s population and over 50% of the world’s GDP. So, if we get a good understanding on the growth paths of those respective countries, we have a good take on what is going on at the global level.
First, let’s focus on population growth and observe the related rapid drop in fertility.
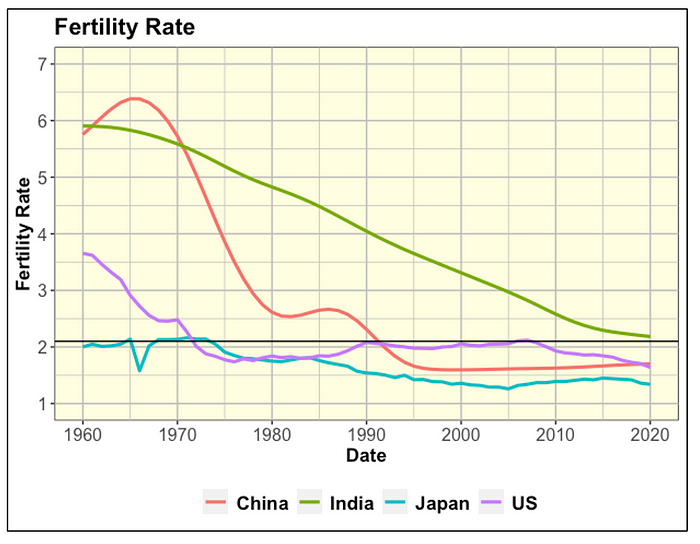
As shown above, the fertility rate has dropped everywhere. Japan’s fertility rate has been below replacement rate (the black horizontal line at the 2.1 level) since the early 1970s; and so has the US one. China’s fertility rate has dropped the fastest from close to 6.5 in 1965 to around 1.6 currently (also much below replacement rate). India’s fertility rate has dropped at a slower pace than China. But, it has still dropped markedly from close to 6 in 1960, to just about at the 2.1 replacement rate currently.
China’s rapid drop in fertility rate is attributed to its one-child policy implemented in 1970 until 2021. However, it is puzzling that other Asian countries (Taiwan, Thailand, South Korea) experienced a similar drop in fertility without a one-child policy.
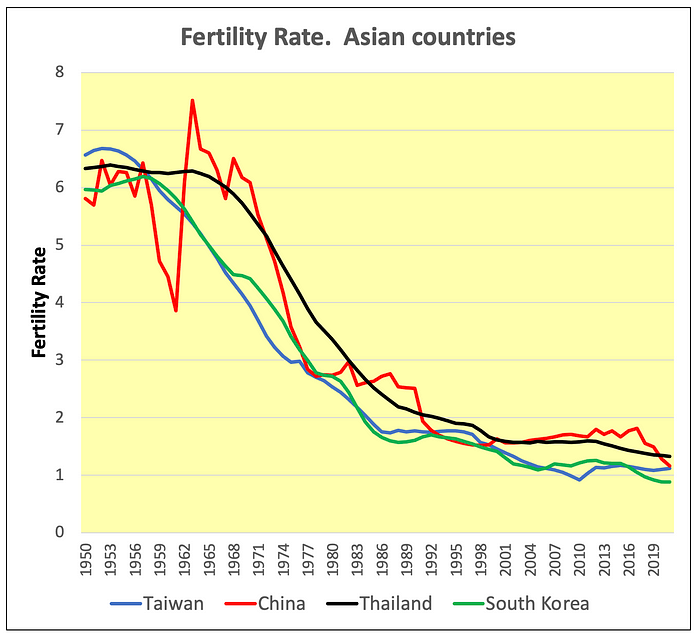
Even though the one-child policy may have contributed to China’s rapid drop in fertility, the other Asian countries pretty much followed the same demographic path just by experiencing a rapid socioeconomic development since 1950. Throughout these Asian countries, women’s education levels rose, job opportunities improved, and women’s labor participation rates increased. As a result, these nations’ fertility rates declined rapidly.
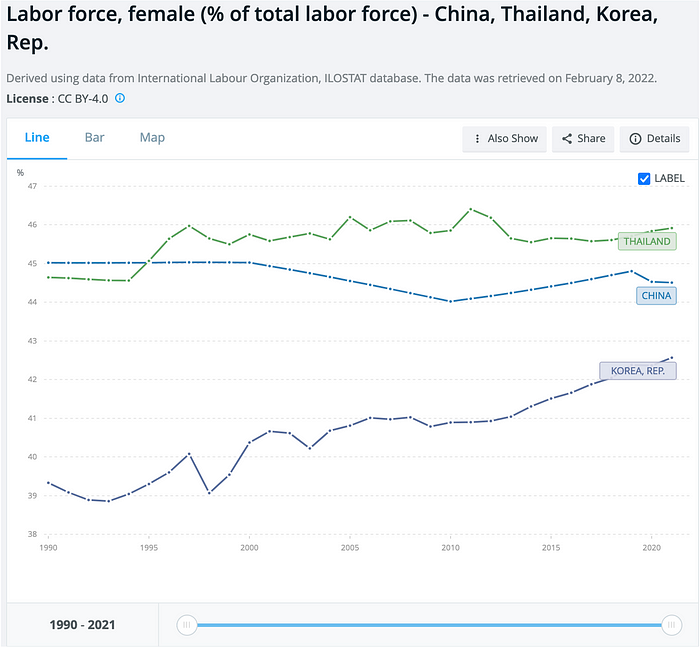
I could find only limited data on the mentioned countries’ women labor participation from the World Bank. The data only goes back to 1990. By then much of the observed drop fertility rates had occurred. However, in the case of South Korea we can see how women labor participation has continued rising rapidly; and, it has contributed to a continuing drop in fertility rate.
A drop in fertility is associated with rapid population aging.
Let’s look at some age pyramids in 1950, 2020, and a 2100 forecast.
Age pyramids in 1950
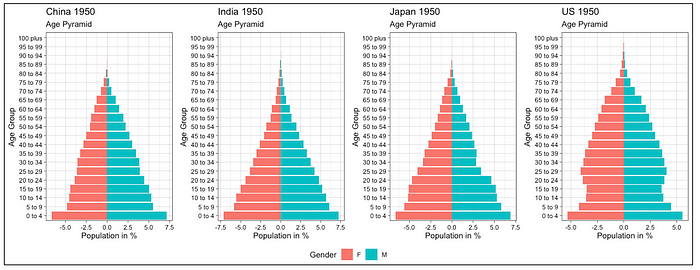
In 1950, the age pyramids of the four countries look similar. They have a large base with an abundance of youth, and a narrow pointed top with a scarcity of elderly. You can see that the US age pyramid is a little bit older than the others.
Age pyramids in 2020
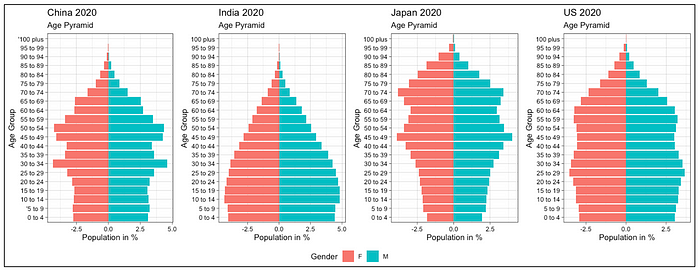
By 2020 the age pyramids of all four countries have aged rapidly. This is especially true for China and Japan. The youth foundation has narrowed (declining fertility) and the elderly tranches have widened (rising lifespan). The US follows a similar trend, but to a milder degree. Its population has not aged as rapidly. And, India’s population has aged even less rapidly, even though it still aged materially since 1950.
Age pyramids in 2100
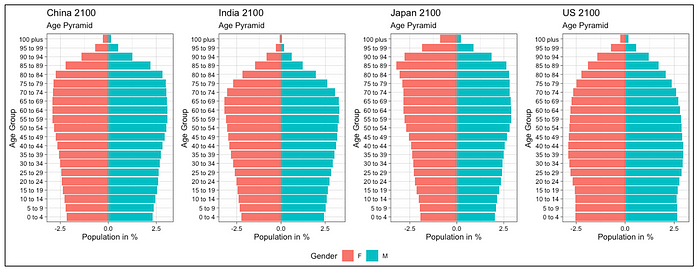
Now, using the UN Population Division forecast out to 2100, all four countries are expected to continue aging quite rapidly. They actually don’t look like pyramids at all, but more like urns.
Time series projections out to 2100
Let’s look at these same UN Population Division projections as a time series to observe population changes out to 2100. Let’s first focus on China and Japan that are both expected to experience similar very rapid population decline.
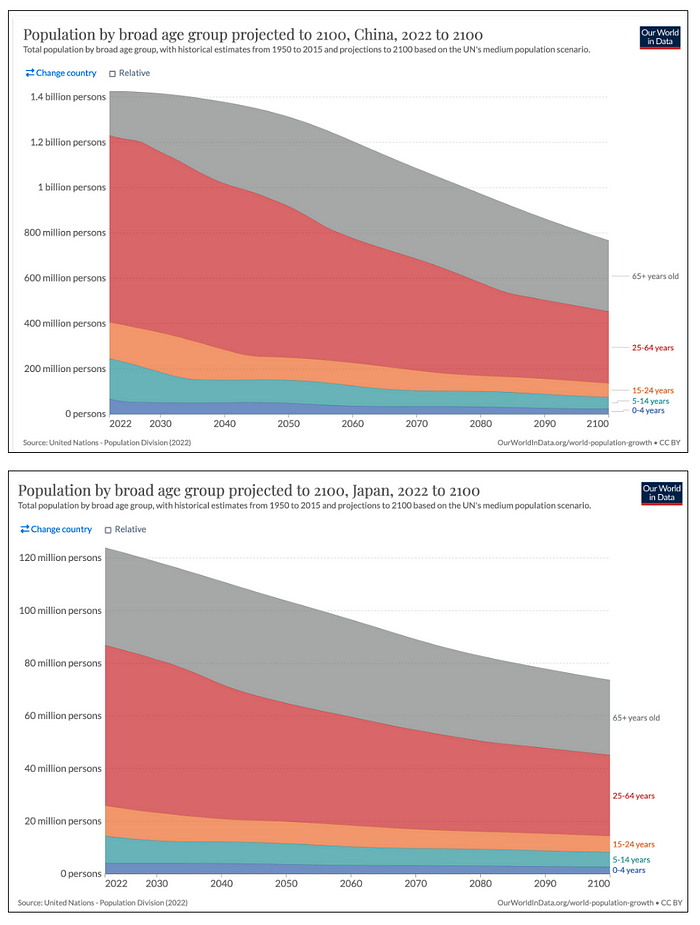
As shown above, the populations of both China and Japan are expected to contract rapidly through the end of the century. China’s population of 1.43 billion is forecast to decrease by — 46.3% to 766.7 million by 2100. Over the same period, Japan’s population is expected to decrease by — 40.6% from 124 million to 73.6 million.
Now, turning to India its population level is expected to hold up.
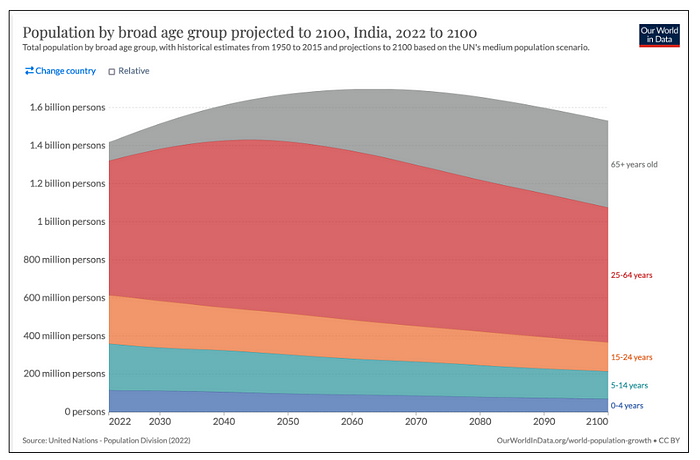
India’s population of 1.42 billion is expected to peak at 1.70 billion in 2062, and decline to 1.53 billion by 2100 (still higher than in 2022). India will maintain its population level because its fertility rate will remain above replacement rate for a while. However, notice that after 2060 India’s population will age quite rapidly (see the thickening gray tranche of 65+). At that point, India’s population will start declining, and it will follow a similar path as China and Japan… only with a 40 year lag.
Now turning to the US, its population will continue increasing but at a very slow rate.
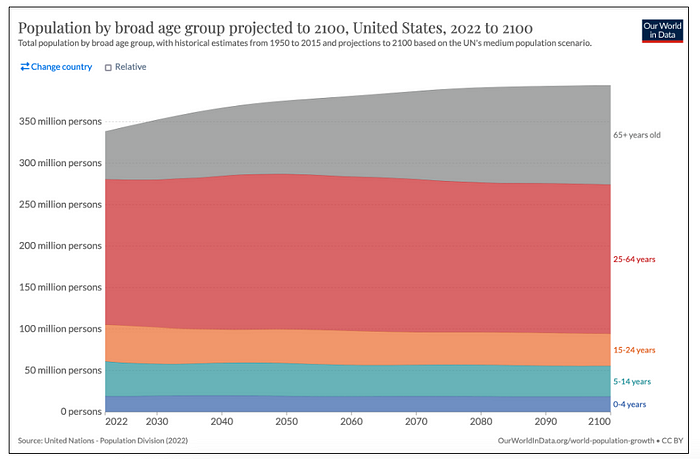
The US population will increase from 338.3 million in 2022 to 390.2 million in 2077. Thereafter, its population growth will remain virtually flat as it will reach only 394.0 million by 2100. You can see that population aging will continue (thickening of the 65+ tranche). The US is expected to experience a higher immigration rate than the other countries. The latter will compensate for the US fertility rate that is already much below replacement rate.
Interestingly enough, the US demographic pattern resembles the one for the entire world as shown below.
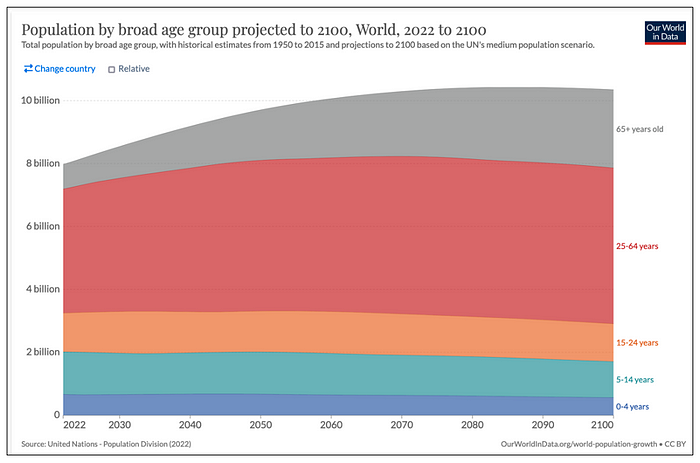
The world population is expected to increase from 8.0 billion in 2022; and peak at 10.43 billion in 2083. Thereafter, it will start to very slowly decline to 10.35 billion by 2100.
Many regions such as Europe and Russia are on the same demographic path as China and Japan (rapid population decline). At a global level, this regional rapid population decline is compensated by a forecast very rapid population growth in Africa. All other regions (South America, etc.) typically follow a path somewhere between China & Japan on one hand and India on the other. So, on a global basis when netting all the different demographic growth rates the world’s demographic path ends up looking a lot like the US.
Now turning to growth in real GDP per capita…
… as measured by compounded annual growth rate over a 10 year period, we observe that the four countries that dominate today’s world economy are on independent paths.
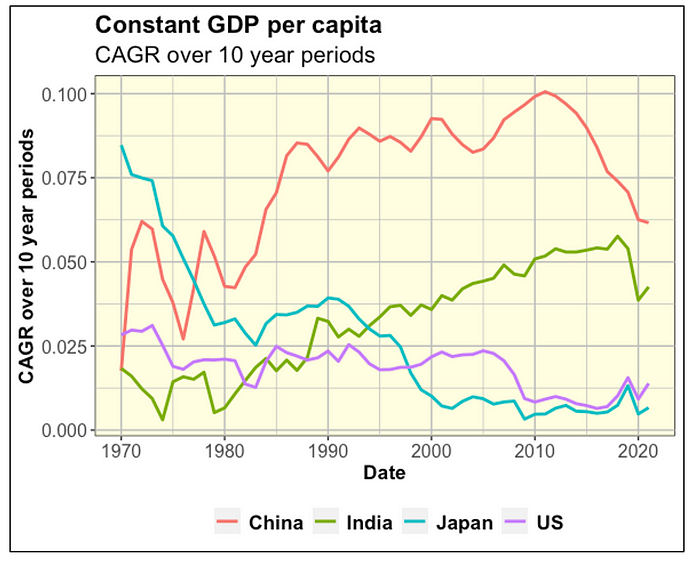
China’s growth in real GDP per capita (as specified) has grown very rapidly reaching a staggering unsustainable rate of 10% by 2010. China was very much a third world economy in the 1960s, and it played catch up with the developed world at a very rapid pace. Notice, that since 2010 China’s growth rate, as measured, has plummeted and is now close to 6%. According to an article in The Economist, “Shining Lights on Lies”, published on September 29, 2022, it indicated that China’s economy may have grown at less than half its reported pace over the 2002 to 2021 period. Whether authentic or not, one can expect China’s growth rate to further drop rapidly and converge towards the lower growth rates of other developed countries such as Japan and the US.
India is still at a much earlier stage of development than the other countries. And, its real GDP per capita has risen from a very low level in the 1970s and 1980s. Its growth rate as measured reached close to 6% until fairly recently. However, it has declined to closer to 4% by 2021. This was in part due to COVID, but also a reversion-to-the-mean effect whereby rapid growth rates, over time, will converge downward towards the slower growth rates of developed countries. The mentioned Economist article suggested that India’s economic growth rate is also much overstated, but not nearly as much as China’s.
Japan is interesting because it undertook its rapid economic growth much earlier than China and India. And, it converged towards the slower economic growth of fully developed countries much earlier too. Looking at the graph, Japan in 1970 was where China was in 2011 and India in 2018. These respective years represent downward inflection points when the economic growth (per capita) of the respective countries appeared to slow. This process typically does not revert back. In this case, The Economist article did not detect any overstating of economic growth.
The US has been a fully developed economy for longer than the other countries. As a result, its economic growth per capita has been relatively low vs. countries undergoing rapid economic development in transition from a third world to a first world country. Even so, we can still notice a downward inflection point in 2005, when economic growth per capita was 2.36%, and it is only 1.39% in 2021 (CAGR over past 10 years). The Economist article did not detect any overstating of economic growth.
Now, looking at the world real GDP per capita growth we observed a pronounced slow down since around 2010.
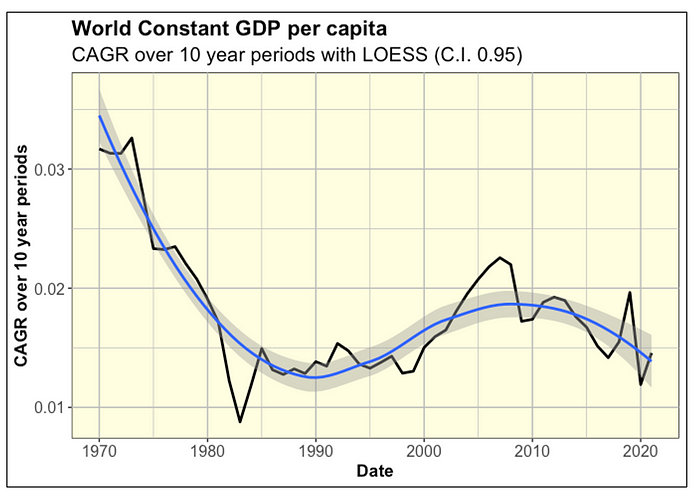
I used a LOESS model to reduce the inherent data volatility and observe the representative underlying trend. We can see that the world real GDP per capita growth rate has been declining since 2010. This decline preceded COVID by over a decade.
Conclusion
So far we have looked at trends and prospects out to 2100 for population and only to the present for economic growth per capita. Regarding population, the UN Population Division forecast already entails that the world’s population will start declining after 2083. Even though we did not observe a similar forecast for economic growth per capita out to 2100, our LOESS model indicates that such growth is already decelerating as we speak. And, it is likely to continue decelerating out to 2100 and beyond.
Now, envision we contemplate what the respective growth trends will be from 2100 to 2200. It is likely population may continue declining for a while longer, and economic growth per capita may continue decelerating. However, economic growth per capita could very well remain positive and compensate for the population chronic decline. And, on a net basis the world economy could remain at the same level.
Let’s look at a few scenarios to observe what such a world would look like 200 years down the road. The table below shows that if real GDP p.c. keeps on growing by 0.50% p.a. (countered by a symmetric contraction in population to keep overall real GDP constant), the population would be just a bit above 1/3 its current size (a decrease of — 63% over current level). And, real GDP p.c. would be nearly 3 times current level (2.71 times to be exact). This is a rather strange outcome; yet, it appears to fall within the realm of the possible. Other scenarios are associated with lower growth rates and appear likelier as growth rates decline closer to zero.
However, the above would still entail that the world economy would have entered a zero-growth era that could last for a very long time. By 2200, the world economy could be way out on the flat part of the S curve on the right side, much beyond the second inflection point.
The above considerations have huge implications for capitalism and stock markets.
In the absence of overall economic growth can capitalism survive? Yes, it could in the form of small businesses, contractors, craftsmen, gig economy, open source platforms, cooperatives, and other organizational forms associated with private ownership instead of government ownership.
Without overall economic growth can stock markets survive? Not in their existing form. In the absence of any economic growth component all foundational investment models and theory pretty much fall apart (CAPM, Dividend Discount Model, Discounted Cash Flow Analysis, etc.). This is an issue I will explore in a following article.

Gaetan Lion is an independent researcher with expertise in economics, econometrics, investments, risk management, statistics, and quantitative analysis. His areas of interest include demographics, economics, investments, Climate Change, health care, sports, and politics.