
Blog Post < Previous | Next >

G. Lion
Is the U.S. the smartest country? Not by a long shot! It may not matter as much as you think
Introduction
Within this essay I will compare the smarts of adults (16–65) across countries along three cognitive skills:
- Literacy
- Numeracy
- Adaptive problem solving (the ability to solve problems using modern technologies often using multi-step processes)
I have extracted information on the topic from the OECD Survey of Adult Skills 2023.
Literacy and Numeracy
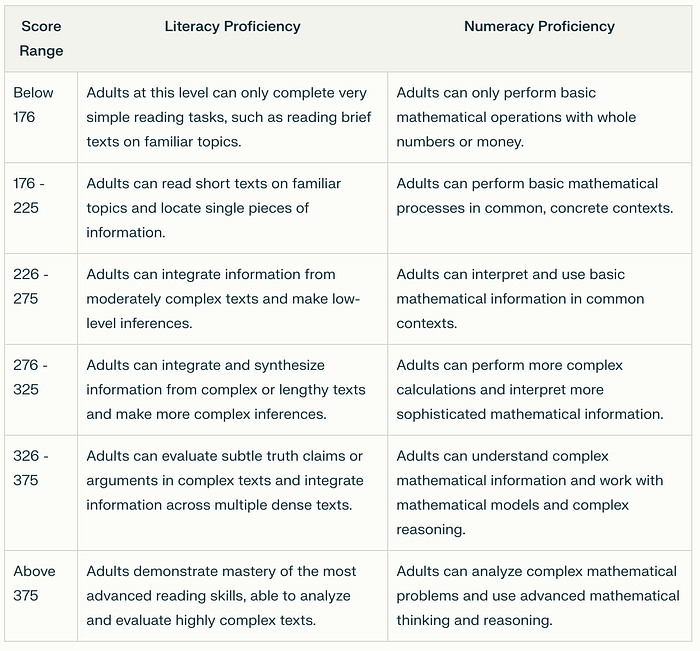
The OECD Survey scores countries’ performance using a scale that ranges from 100 to 400. The meaning of score ranges regarding literacy and numeracy is described in the table below.
The scatter plot below ranks countries from low skill (score 210) to high skill (290–300). The X-axis reflects literacy, and the Y-axis numeracy.
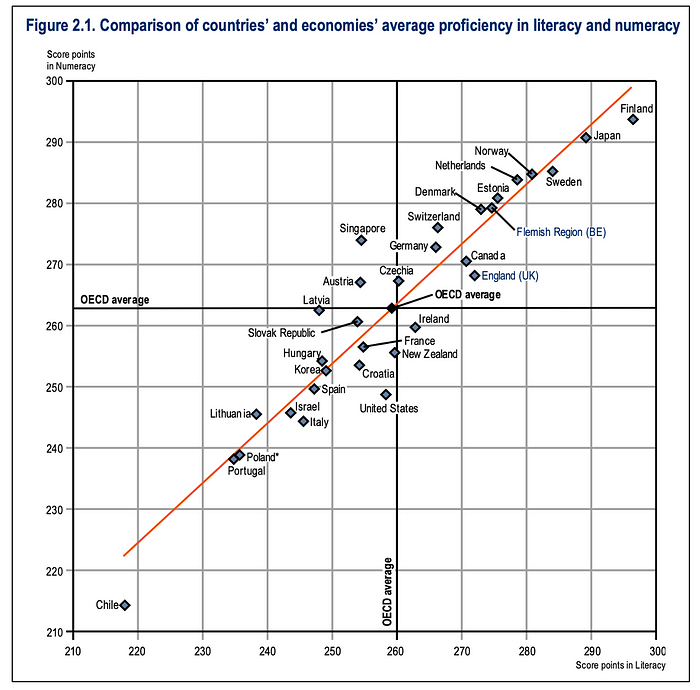
Main point from the scatter plot above:
- The Scandinavian countries (Finland, Norway, Sweden, Denmark) do well. They are among the leaders on both dimensions with Finland coming in the top spot
- Among the reviewed Asian countries, Japan is the only that does very well. It comes in second in both dimensions. Singapore’s literacy is much below the OECD average. And, South Korea comes in below average on both dimensions
- Among Anglo-Saxon countries, Canada and the U.K. both perform a bit above average. Ireland, New Zealand, and the U.S. all perform a bit below average on either one or both dimensions\
- Germanic countries come in a bit above average on both dimensions. I include in this group Germany, Switzerland, Netherlands, and Belgium (Flemish)
- France is a surprise as it comes in a bit below average on both dimensions. Given this country’s reputation for culture and intellect, I would have expected it would have scored better
- Estonia is the small country that does well. I have often heard that Estonia has one of the most modern and efficient Governments. This must include a very good education system.
Adaptive problem solving
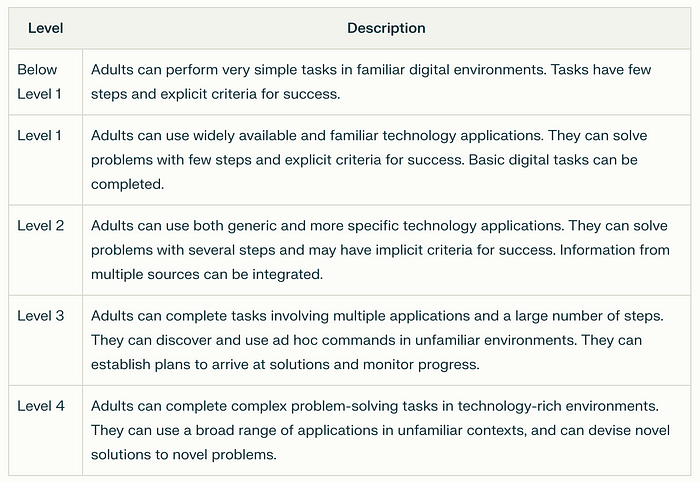
The OECD Survey rates adaptive problem solving performance along 5 different levels. The table below describes their respective meaning.
The diagram below ranks the countries on adaptive problem solving proficiency.
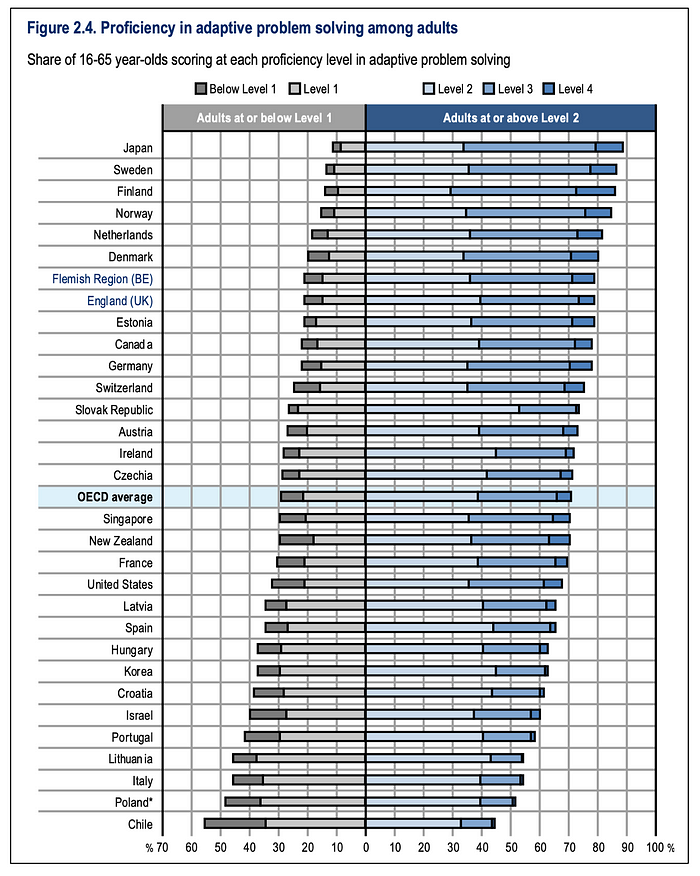
The diagram above displays the distribution of performance among 5different categories for each country.
The countries’ ranking in adaptive problem solving appears nearly identical to the countries’ corresponding position on the scatter plot disclosing literacy and numeracy. The same explanatory comments for literacy and numeracy apply to adaptive problem solving.
It is interesting to notice that France and the U.S. are just about tied (again). And, they are very close to Singapore (that I would have expected to be far higher in any rankings).
Again, Estonia is doing well on this dimension, too.
Difference between the top and bottom decile in performance on literacy, numeracy, and adaptive problem solving
The OECD refers to the above difference as “inequality.” I am using instead a neutral term: “difference.” Let me explain why.
Let’s say you have two countries, and they each have 10 workers. In the first country, they are all top performers on all dimensions. In the second country, the workers’ performances cover the whole range from high to low.
In the first country, out of the 10 workers maybe just 3 are gainfully employed. The other 7 are either unemployed or over-qualified. In the second country, all 10 are gainfully employed with their respective skills’ levels matching well the demand of their jobs. Obviously, the second country will fare better than the first.
Looking at the diagrams below that looks at the difference in skills between the 90th percentile and the 10th percentile, the U.S. leads on skill differentiation in literacy and numeracy. And, it comes in 2nd on adaptive problem solving.
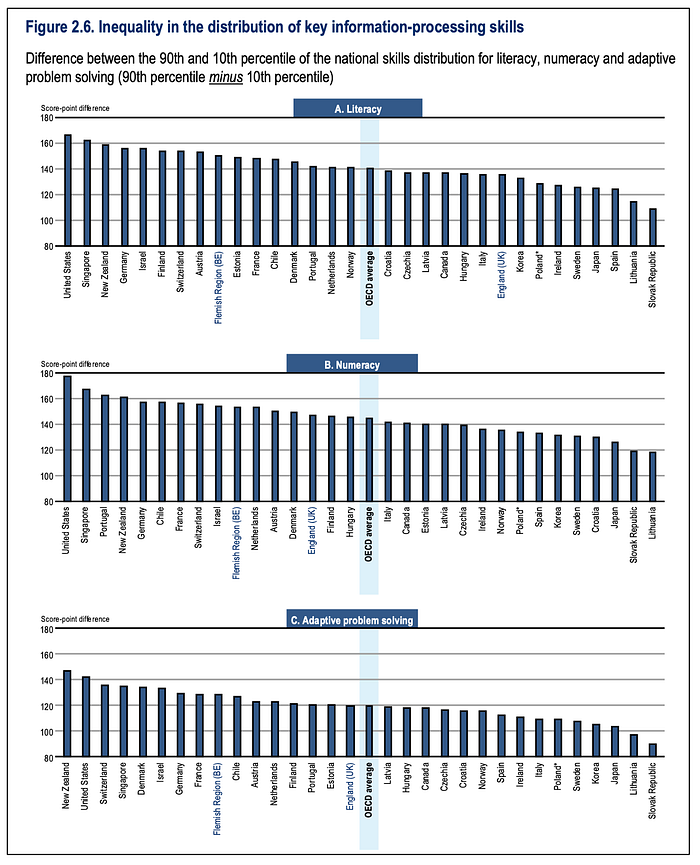
When looking at the diagrams above, many will be chagrined by the U.S. record “inequality” level. However, as stated earlier, there may be a stealthy labor market advantage to such skill differentiation. Of course, a country does not want to have a large unemployable underclass with very low skill levels. So, there may be a delicate equilibrium between optimal labor markets’ skill differentiation and having an unemployable underclass as small as possible.
Long term trends
In association with the International Adult Literary Survey (IALS), the OECD compiled long term literacy trends since 1994 for 16 countries.

Out of the 16 reviewed countries, only Finland has experienced a material positive long term trend where its literacy level in 2022 is markedly higher than in 1996, No other country among the 16 does that.
The period around 2012–2014 is a pivot point for numerous countries:
- All Scandinavian countries improve markedly.
- A bunch of countries experience a decline in performance. These include the U.S., Italy, U.K., New Zealand, and Ireland.
Over this period, it is perplexing why the Scandinavian countries have improved while the other mentioned countries’ respective performances have weakened.
Omissions
When reading this article you will have a lot of follow up questions.
- Do immigrants not fluent in the native language impact the results?
- How about differences based on education levels of the individuals? or their parents?
- How about the impact of gender, age, etc.?
All the above questions are addressed in the OECD Survey of Adult Skills 2023 (199 pages).
I have omitted the above issues for two reasons.
- The first one is to keep this article down to a reasonable size.
- The second one is that none of the mentioned socio-demographic factors explain the U.S. mediocre performance. For instance, the U.S. performance is somewhat affected by immigrants, but some of the other countries are just affected if not more.
Human Capital vs Economic Performance
I combine literacy, numeracy, and adaptive problem solving into a single factor I call human capital. As described you would think that the higher level of human capital a country has, the better its economic performance.
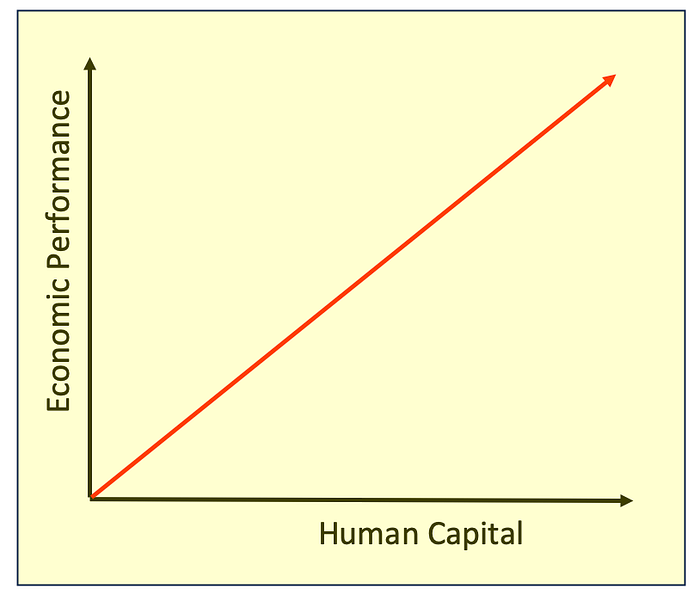
The graph above depicts a hypothetical positive relationship between human capital and economic performance. The red line is an idealized regression line denoting this relationship as depicted has a positive correlation and a positive slope.
The visual data we will look at captures the level of human capital as a “rank” number. So, a country that ranks 1st in human capital would be expected to have a superior economic performance to one that ranks 13th. So, now the correlation and the slope are negative.
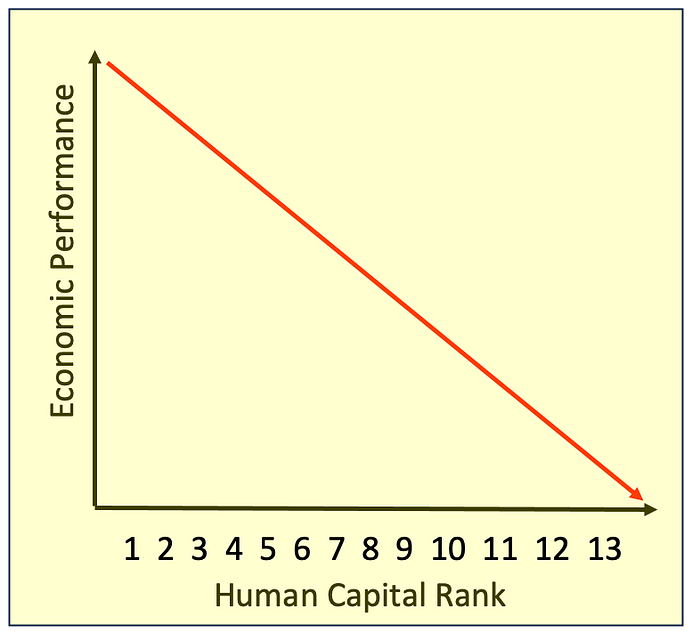
Now that you understand the graph above, you get that the underlying relationship between human capital level and economic performance is still positive.
Let’s compare the U.S. economic performance with the 12 countries that rank ahead of it on human capital. As we will see the U.S. is among the superior economic performers even though it ranks last in human capital among the 13 selected countries.
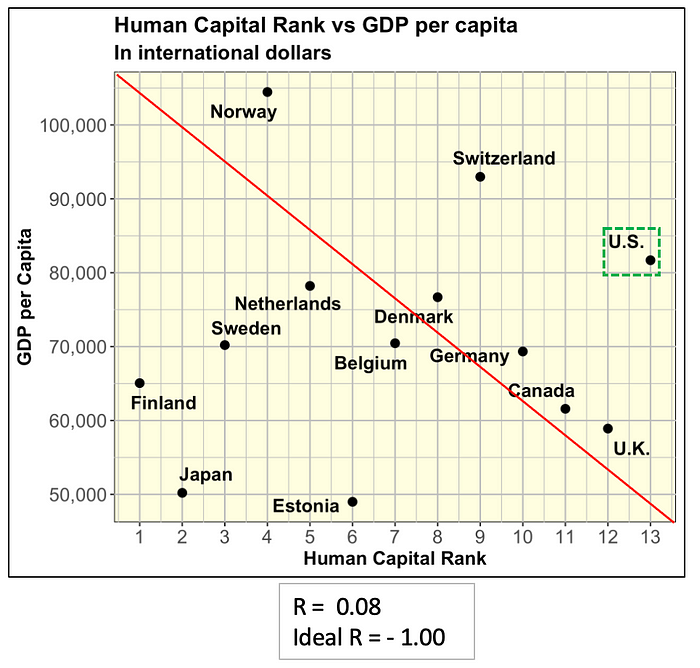
Human Capital Rank vs GDP per capita
You would think that greater human capital would translate into a greater GDP per capita (on a purchase power parity basis). If that were the case the R correlation between rank number and GDP per capita would be equal to negative — 1.00 represented as the red line within the scatter plot below. But, it does not work out that way.
The relationship between the two variables is random with a correlation close to Zero. The U.S. that ranks last in human capital, actually comes in 3rd in GDP per capita (most recent data from World Bank).
Human Capital Rank vs Real GDP Growth
You would think that greater human capital would translate into higher real GDP growth. If that were the case the R correlation between rank number and GDP per capita would be equal to negative — 1.00 represented as the red line within the scatter plot below. But, it does not work out that way.
The relationship between the two variables looks somewhat dubious as it appears positive (correlation = 0.45) which is the wrong sign. As shown, the U.S. that ranks last in human capital, actually comes in 1st in real GDP growth (most recent data from The Economist, Trading Economics).
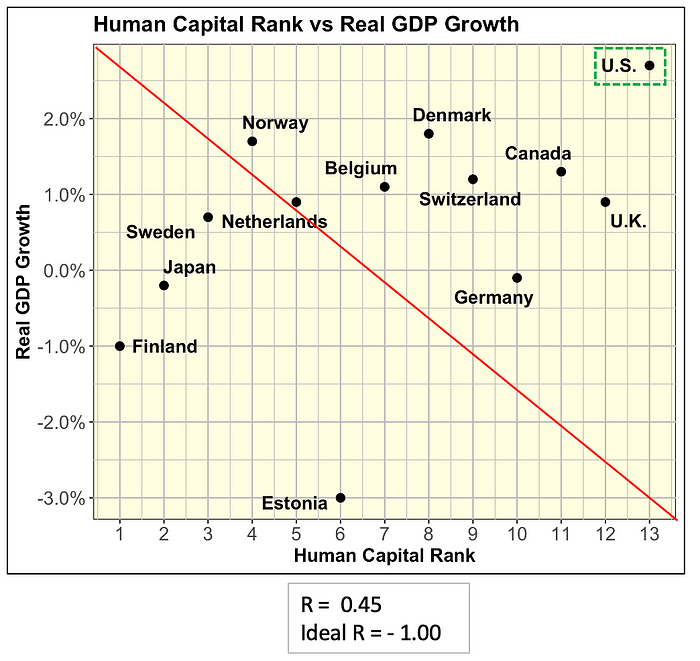
Notice within the scatter plot above how the top two ranked countries on human capital (Japan, Finland) are experiencing a recession . The U.S. is in the opposite situation. These 3 countries contribute to distorting the directional sign of this relationship. If these 3 countries were positioned on the red line, the relationship would make more intuitive sense. And, the correlation and slope would have the appropriate negative sign.
One could argue that the above just reflects the most recent economic data. And, that it does not reflect long term trends. However, if we look at long term trends, it would confirm that the U.S. has grown faster than all the mentioned countries. In an earlier article, I looked at trends going back to 2019.
One could look at long term trends going back to the 1980s, and it would confirm the same phenomenon. The U.S. economy has grown faster than the others.
Human Capital Rank vs Unemployment Rate
You would think that a superior human capital level would translate into a lower unemployment rate. If that were the case the R correlation between rank number and unemployment rate would be positive +1.00 represented as the red line within the scatter plot below. But, it does not work out that way.
The relationship between the two variables looks somewhat dubious as it appears negative (correlation = - 0.28) which is the wrong sign. As shown, the U.S. that ranks last in human capital, actually comes in 7th in unemployment rate (most recent data from The Economist, Trading Economics).
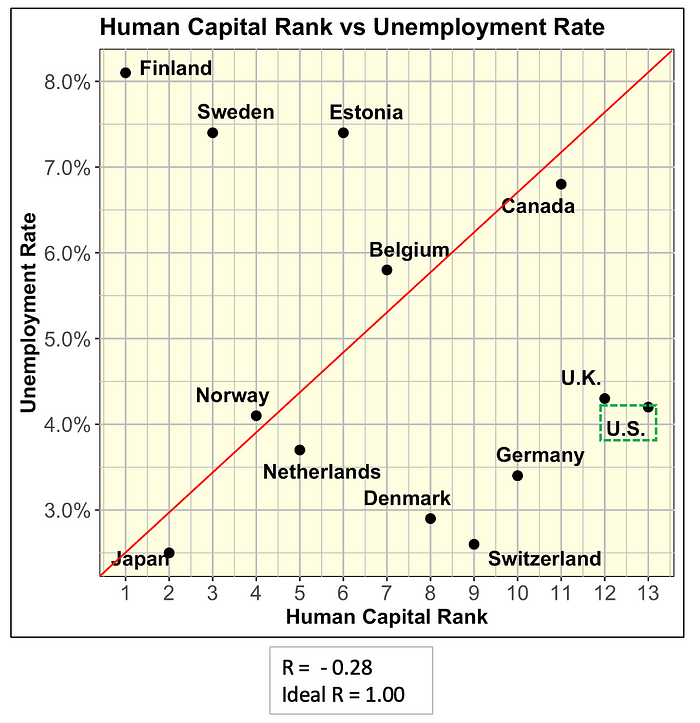
As shown above, Finland, Sweden, and Estonia, who rank well on human capital, all have high unemployment rates close to 8.0%. The U.S. is in the opposite situation. These 4 countries contribute to distorting the directional sign of this relationship.
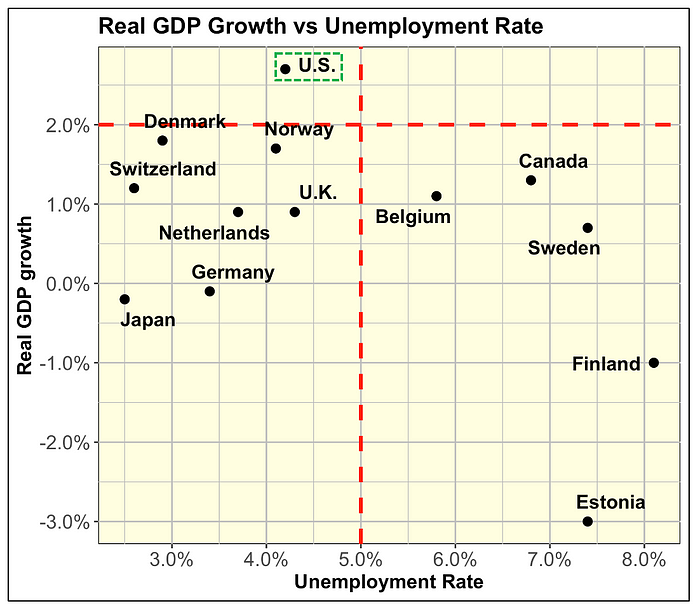
Real GDP Growth vs Unemployment Rate
When comparing all 13 countries on real GDP growth and unemployment rate, the U.S. appears to be the best performer. Out of the 13, it is the only one with a real GDP growth greater than 2.00% and an unemployment rate lower than 5.0%.
Human Capital vs Economic Performance Conclusion
As reviewed, human capital (as defined) is not deterministic of economic performance. The U.S. is a case in point. Even though it ranked last on human capital (among the 13 countries), it was among the better economic performers. What explains that? We can advance several considerations:
- We could go back to the two countries with 10 workers metaphor;
- The U.S. business climate is a magnet for innovators. Just a few of them pretty much changed our civilization and made the U.S. a technological leader. Just to mention a few deserving names: Jeff Bezos, Steve Jobs, Bill Gates, and Larry Page. This phenomenon plays out no matter the average human capital level of the U.S. population;
- Demographic forces also play a role. Both Europe and Japan have aged a lot faster than the U.S. The latter more dynamic demographics translate into a more dynamic economy. “Demography is destiny.” The U.S. demographic advantage is immigration. I have covered this topic in another recent article.
THE END

Gaetan Lion is an independent researcher with expertise in economics, econometrics, investments, risk management, statistics, and quantitative analysis. His areas of interest include demographics, economics, investments, Climate Change, health care, sports, and politics.