
Blog Post < Previous | Next >
Guy
What can we tell from the Tam District Bond poll?
The short answer is that the Tam District Bond is very likely to pass. This is based on the underlying statistics of the recent poll results and the Bayesian statistics that favor local school bonds. Let me gently walk you through the math with a minimal of math and much explanatory data visualization to fully understand what the recent poll meant.
This is a follow-up to the Marin IJ article Dispute over poll bond measure published on the cover page on November 1st. The poll was conducted to evaluate if voters were likely to vote for a $517 million bond measure to shore up the infrastructure of the Tamalpais Union High School District (Tam).
Poll results
Sample size: 397
Response in favor:
a) 63.2% associated with the positive questions
b) 55.4% associated with the negative questions
Average of the two is 59.3%
Error margin + or - 4.9%
Threshold to pass: 55%
Segmenting the prospective voters
Constructing a poll with explicit positive and negative questions is unorthodox. However, it allows one to extract more information. From the above poll, we can segment prospective voters into three categories:
Die-hard supporters: 55.4%
Undecided: 7.8%
Die-hard detractors: 36.8%
Die-hard supporters.
This group is pretty solid. Even if subject to negative advertisement they would still vote for the bond.
Undecided.
This group is undecided. However, they are receptive to positive advertisements such as the one I just received in the mail. We calculated this group % as follows: 63.2% - 55.4% = 7.8%.
Die-hard detractors
This group has made up their mind. They are against the bond. And, positive advertisement is not going to change their mind. We calculated this group % as follows: 100% - 63.2% = 36.8%.
Interpreting the results and strategic implications
Given that the die-hard supporters at 55.4% already cleared the 55.0% threshold for the bond to pass, the outlook is positive. With a bit more advertisement, this bond could well receive 63.2% of the vote. However, spending a ton more on advertisements may not make much of a difference. This bond voting outcome appears to have a high floor at 55.4% and a low ceiling at 63.2%.
Outlook considering earlier school bond measures
Since 2020, I identified three school bond measures in Marin (two in San Rafael, one in Sausalito). The San Rafael ones passed with 64% to 65% in Yes votes. The Sausalito one passed with 73.8% in Yes votes. All three bond measures were associated with the same threshold at 55% for passing and with the same parcel tax rate of $30 per $100,000 of assessed home value.
The parcel tax rate is a good way to compare bonds of different size
Whether a bond issuance is $50 million or $500 million does not tell you what the specific cost per homeowner will be. The parcel tax rate does. It allows to compare the costs born by homeowners between bonds of different sizes.
In view of the above, the Tam bond represents a standard cost level for the homeowners at a level of $30 per $100,000 of home-assessed value.
Exploring polls uncertainty
The poll has a + or - 4.9% error margin. What does that mean visually?

Reviewing the graph above, the overall poll result is 59.3%. It is associated with a + or - 4.9% error margin.
The entire area under the curve is equal to 100%. The area under the curve in between the two vertical red lines represents 95% of the area under the curve. Thus, there is a 95% probability that a poll with a sample of 397 coming in at 59.3% would have an accurate figure between 54.5% and 64.1%.
Let's consider a 92% confidence interval because its left tail hits exactly 55%, the % needed for the Tam bond to pass.
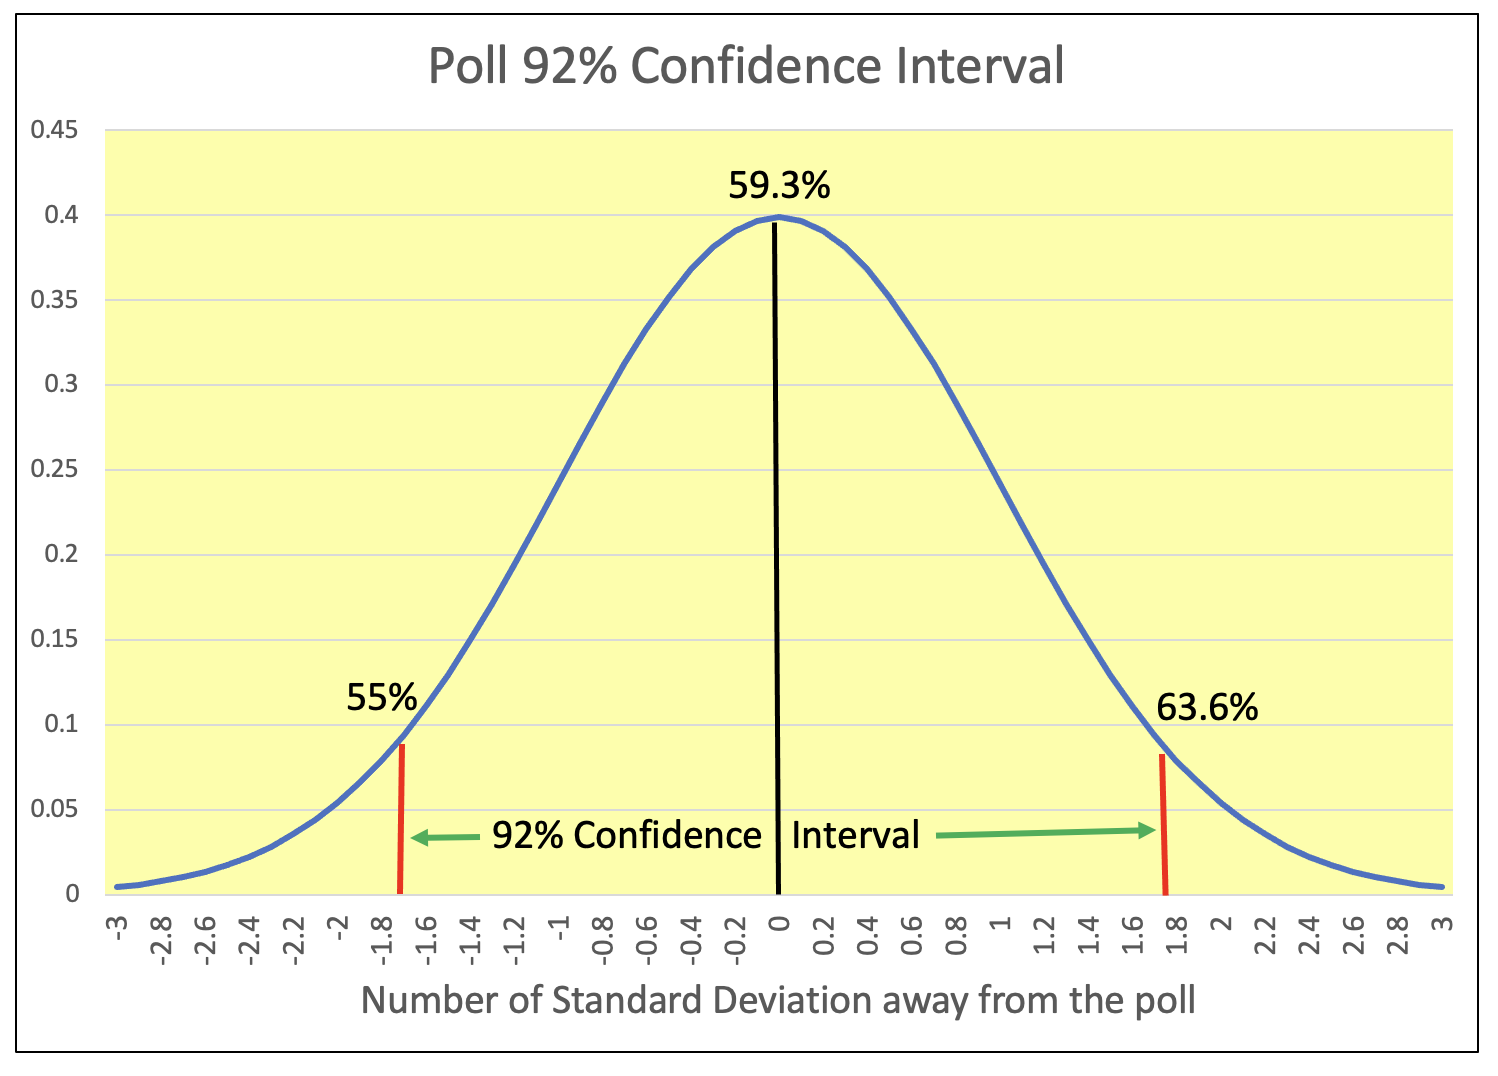 The graph above gives very much the same information as the earlier one. Only now the area under the curve and in between the red vertical lines represents 92% of the area under the curve (instead of 95%). So, now we have a 92% probability that an accurate poll result would range from 55% to 63.6%.
What is the probability of the Tam bond passing given the current poll?
We can figure this out in three different ways. The first two are really easy. We just review the graph above. And, we can split it in three different areas with associated probabilities.
There is a 4% probability the accurate poll result would come in at 55% or lower.
There is a 4% probability the accurate poll result would come in at 63.6% or higher.
There is a 92% probability that the accurate poll result would range between 55% and 63.6%.
The sum of all three is equal to 100% of the area under the curve.
From the above, we can readily figure there is a 96% probability that an accurate poll would come in at:
4% + 92% = 96%
or
100% - 4% = 96%
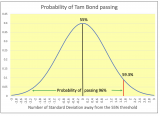
There is a third way of figuring this out that gives you the same result. In the graph below, we construct a similar curve, but instead of centering it on the poll's aggregate result of 59.3%, we center it on the 55% threshold to pass. We observe that the aggregate poll result of 59.3% is very close to 1.8 standard deviation above the 55% threshold (see number of standard deviations on the X-axis). And, that translates into a 96% probability that an accurate poll would be equal to or higher than 55%.

Reviewing the graph above, you can see that if the aggregate poll figure would come in at exactly 55%, there would be a 50/50 chance of the Tam bond passing. You can readily see that when you look at the respective areas under the curve.
When you look at the aggregate poll result of 59.3%, it is fairly out there on the right tail. And, the area under the curve from left to right until the vertical red line is 96%. And, that corresponds to the probability of the Tam bond passing given this current poll.
Stress test for this poll
Let's figure for some reason that this bond measure loses momentum over the next few months and that the support for it drops by 1 percentage point a month. Given that, what would be the probability of the bond passing close to voting time?
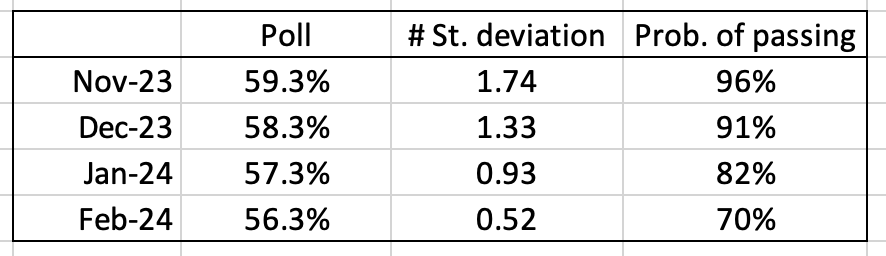
For each month, we calculate the number of standard deviations above the 55% necessary to pass. And, we translate that number of standard deviations into a surface area under the curve (the entire area to the left of the right tail as shown on the previous graph). And, this gives you the probability that the bond will pass.
As shown in the table above, even if the aggregate poll result would drop by 3 percentage points before election time, the bond still would have a 70% probability of passing.
Why do local school bond measures pass more often than not?
It is a combination of plain math and economic incentives. There are two completely different types of voters:
- Renters. They don't bear the direct cost of the parcel tax. Therefore, they are much more likely to vote Yes in support of schools. On the other hand, their voting participation is typically lower than for homeowners.
- Homeowners. Their vote directly affects their pocketbook. So, they are a lot more cautious in voting Yes. And, they do so only if they are committed to the specific purpose of the school bond. On the other hand, their voting participation is much higher because they have skin in the game so to speak.
In view of the above, let's build a simple model to explore how these two different types of voters influence the ultimate vote outcome.
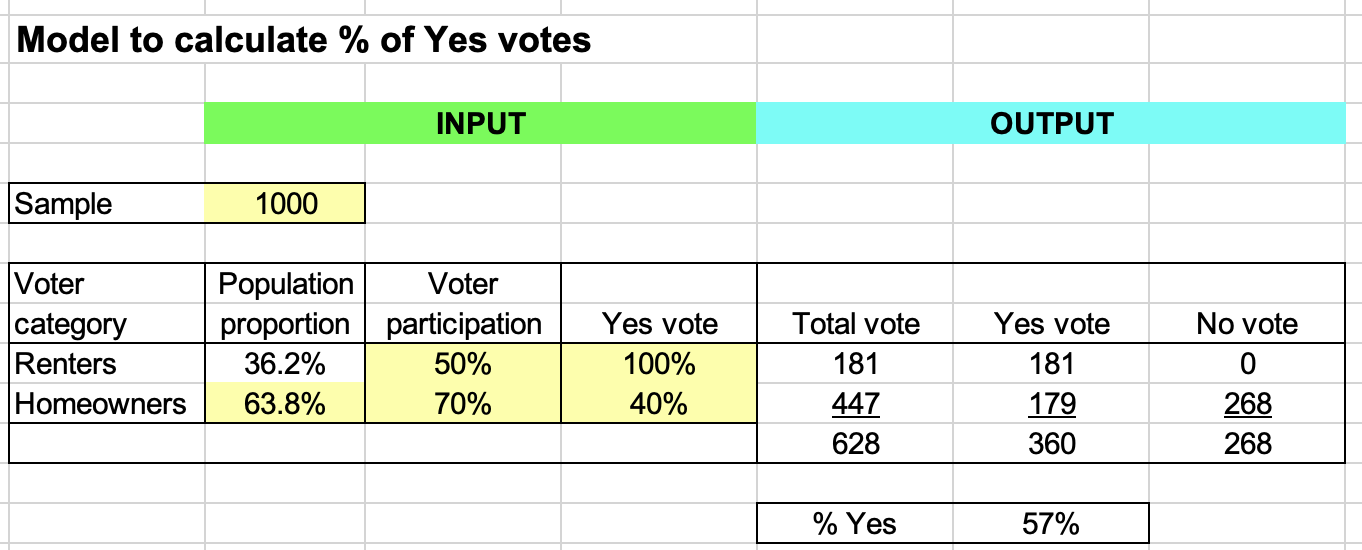
I got the population proportion of renters vs. homeowners (36.2%/63.8%) from the Census. As starting assumptions, I figured that voter participation for renters vs homeowners was 50% vs. 70%, respectively. Voting Yes % was 100% vs. 40% respectively (that's where the economic incentives kick in). Going through the arithmetic, the resulting overall vote would be 57% Yes.
Next, let's sensitize the homeowners voting Yes % and the renters' participation rate and see what the resulting scenarios look like.
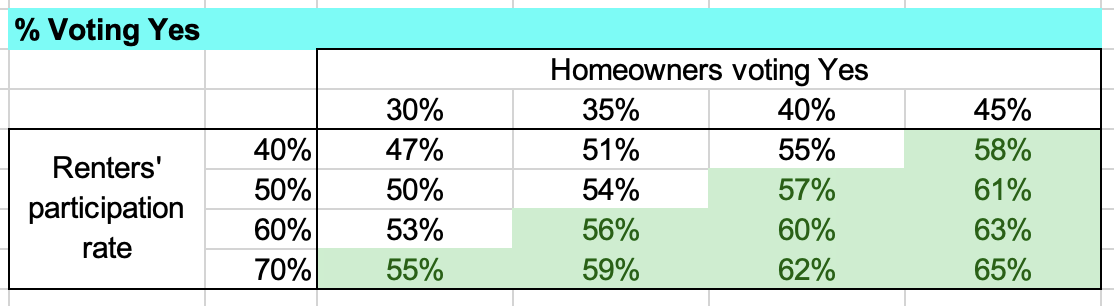 Within the table above, the cells highlighted in green reflect when the overall Yes vote would clear the 55% threshold.
The main point of this explorative model is that local school bond measures can pass (exceed the 55% threshold) despite low support from the homeowners who actually pay the related parcel tax.
What is interesting is that school measures raising funds through direct parcel tax assessment (and not related to bond financing) are subject to a much higher threshold of 66.6%. Back in November of 2022, Ross Elementary Measure C raised funds by levying a direct parcel tax of $1,550 for 10 years. It was subject to the 66.6% threshold. And, it passed with 78.7% in favor. Such a high Yes vote % could not have passed without very strong support from Ross homeowners who actually paid that parcel tax.
The lower 55% threshold for local school bonds was implemented by the voting approval of Proposition 39 in 2000.
Between 2001 and 2013, school measures subject to the 2/3 majority succeeded only 50% of the time. While school measures subject to the lower 55% threshold succeeded 80% of the time [Source: California Special District Association]. That's a huge difference.
The above has huge implications for the upcoming bill ACA 1 which would lower the 66.6% threshold down to 55% for just about every kind of bond and special taxes possible. This is a run around Prop 13. That is a topic for another day.
THE END