
Blog Post < Previous | Next >

Wikimedia Commons
Is Marin destined to become a desert? Nope
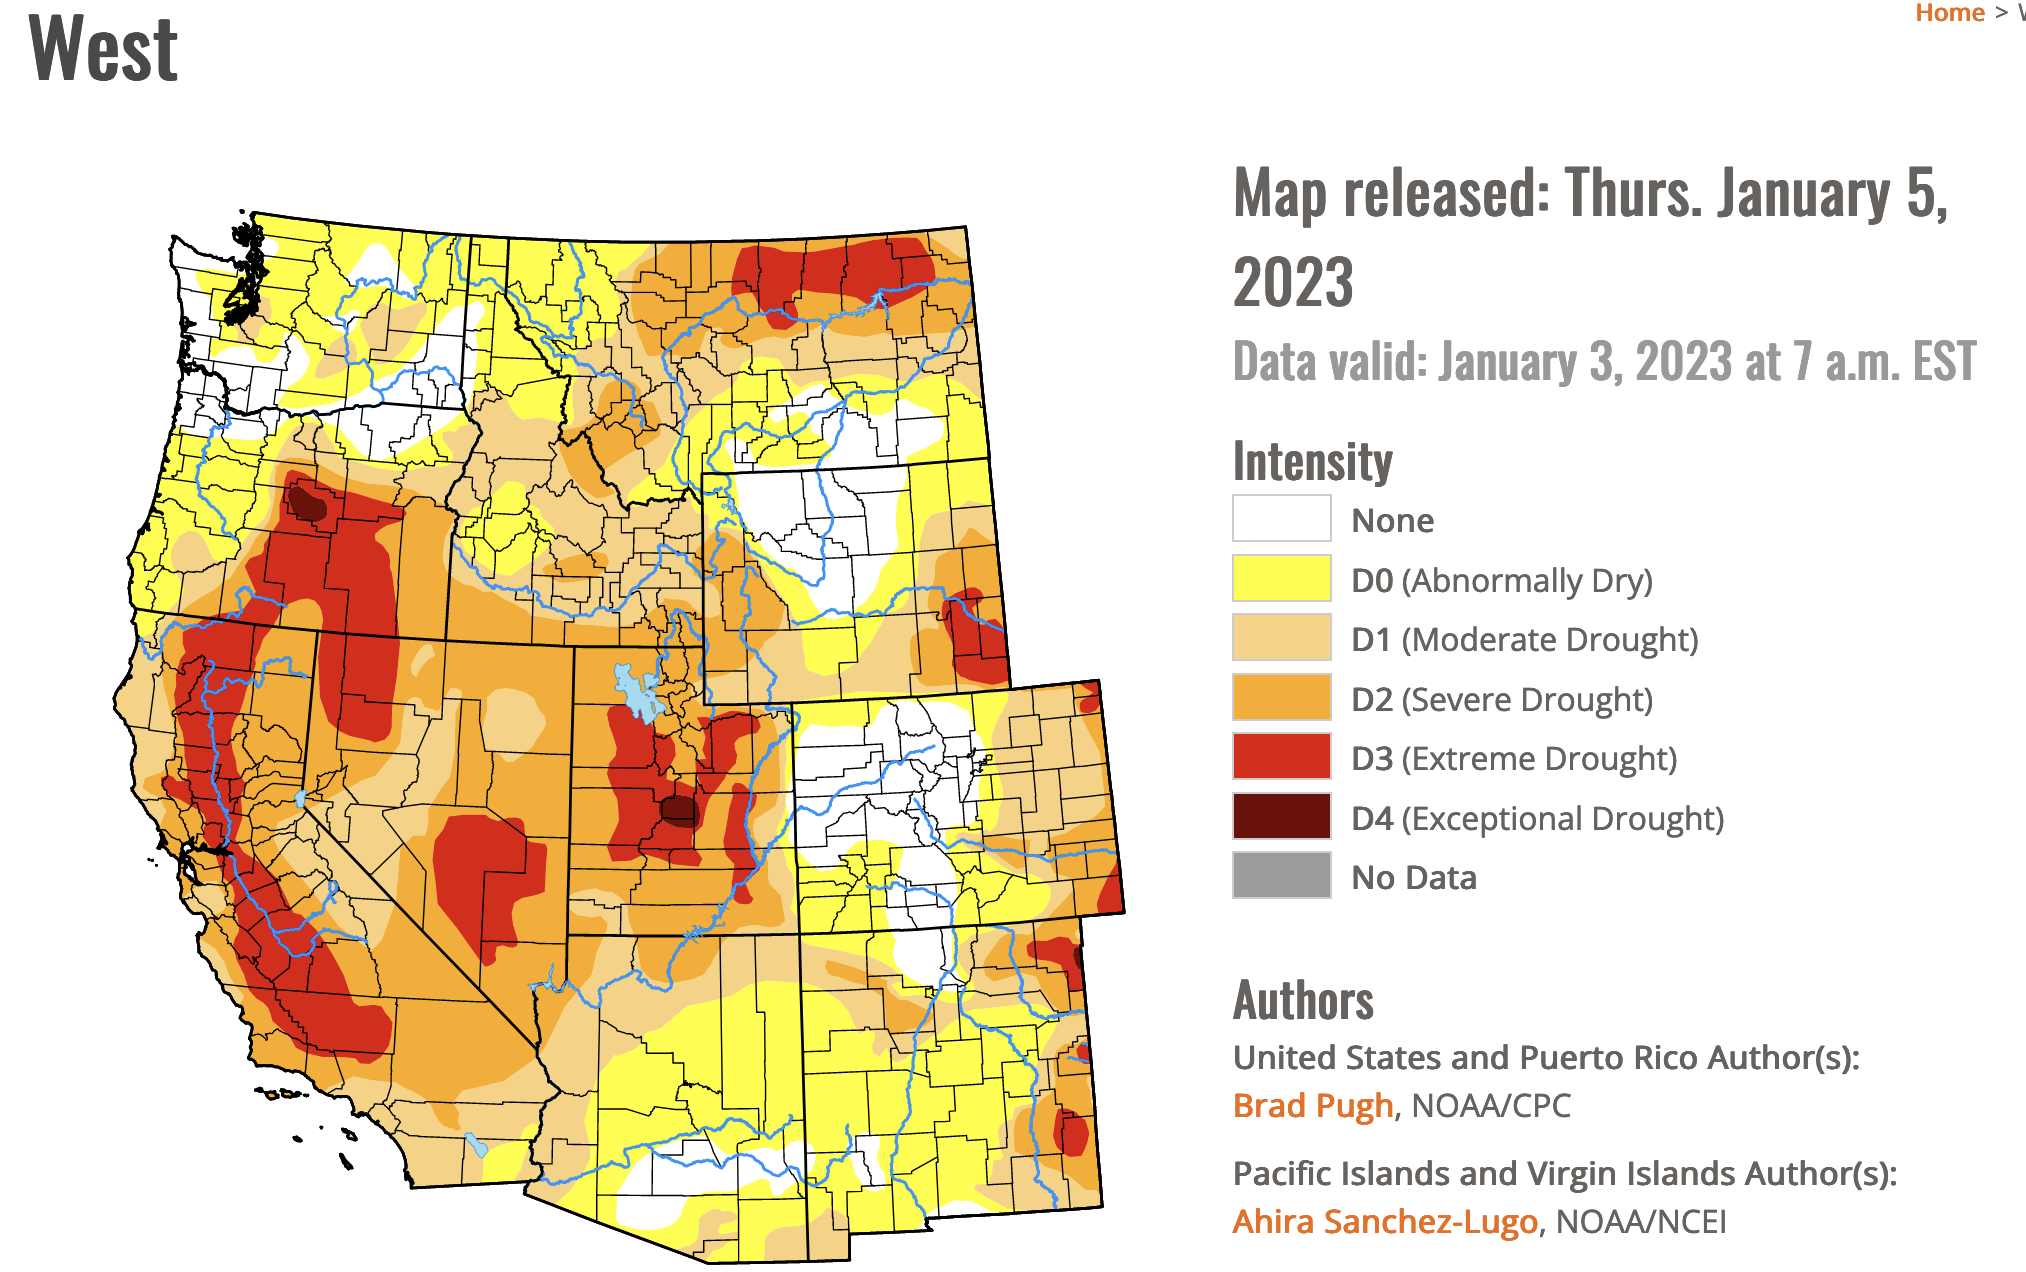
The US Drought Monitor map, shown below, depicts very broad based drought conditions throughout the West as of January 5, 2023.
Within the Economist “The World Ahead 2023”, in their article “A new low” on page 36, they state:
“Across the American West, the landscape bears scars from the
mega-drought that has dehydrated the region for more than two decades…
The current drought is the driest 22-year period the southwest has seen
in 1,200 years, according to a paper in Nature Climate Change.”
If you look closely at the map above, Marin County is within the D2 Severe Drought zone. And, it probably has been in that zone for years.
The map characterization of Marin County being in a chronic state of severe drought is highly inaccurate.
Marin County benefits from a micro-climate that is truly divergent from its surroundings. It rains a heck of a lot more in Marin than in any nearby region.This is due to its topography that includes a pretty large mountain that rises to 2,500 feet above sea level: Mount Tam.
And, Mount Tam because of the orographic lift effect[1] is truly a water manufacturing factory as shown on the map below. See the only large dark blue spot denoting average rainfall of much above 45 inches per year.

Looking at long term rainfall trends, Marin County is not getting any drier. Focusing on data at the Lake Lagunitas station from the MMWD, you can observe three different periods.

Source: MMWD
As shown above, from 1917 - 1950, Marin County experienced dry years when the average yearly rainfall was only 40.9 inches compared to 51.8 inches since 1951 to 2021.
Also, notice that the volatility of Marin's rainfall over the baseline period since 1951 is very much in line with history. The standard deviation over that period is a little bit higher than during the dry years period, and a bit lower than during the early wet years period. This is just what you expect given the periods respective average and median values (in such a time series of a single variable, the standard deviation is typically proportional with the average and/or the median).
Let's have another cut at the data, and focus on the 15 driest years since 1880, and observe their prevalence within the three different periods.

Source: MMWD
As shown on the table above, of the 15 driest years none occurred during the wet years periods, 9 occurred during the dry years period, and 6 during our contemporary baseline period. Given that, these very dry years occurred more than 3 times as often during the dry years period vs. the current baseline period (26.5% of the time vs. only 8.5% of the time, respectively).
During the MMWD 2020-2021 water crisis, everyone interpreted that event as the Marin County's climate becoming ever dryer and more volatile. The above review of the historical data does not support this assertion. Given historical trends, one could have more accurately wondered that it took nearly half a century for a severe water crisis to reoccur. The earlier one was in 1976-1977 which was actually far worse than the 2020-2021 one.
As we know, 2022 was a rather good year for rainfall. It bailed out the MMWD one more time given the latter's inadequate water supply infrastructure to support its 192,500 customers during periods when rainfall is below 35 inches for more than one year.
Ok, the history of our rainfall is rather reassuring, but how about the current and prospective impact of Climate Change?
Let's review Climate Change on two different dimensions: temperature and rainfall. And, we will use the NOAA models and data visualization to investigate these respective prospects. The NOAA is the Federal agency most qualified to undertake such climate related studies and models.
Focusing on temperature, here is Marin County's temperature history using the NOAA data.

The graph on the left, shows the 10 year moving average maximum daily temperatures out to 2013. This is actual and reliable historical data. The graph on the right adds on the NOAA temperature projections out to 2021.
The graphs should leave one rather ambivalent. The true historical data actually shows a decline in temperature since the decade ending in 1998 until the one ending in 2013. But, when looking at the added on data including NOAA projections out to 2021, you see a very sharp upward hockey stick pattern associated with a 2.6 degree Fahrenheit jump in temperature between the decade ending in 2013 and the one ending in 2021. The NOAA has yet to update its data with actual historical observation to test whether their hockey stick shaped forecast out to 2021 was reasonably accurate or not.
How about the future, let's look at NOAA's long term forecasts for Marin County regarding both temperature and rainfall. The NOAA constructs two emission scenarios. The lower emission scenario entails that greenhouse gases emissions peak in 2040, and decrease rapidly till 2100. The higher emission scenario entails that emissions continue rising.

The table on the left shows a progressively rising difference over time in the temperature forecast between the two emission scenarios. Between 2020 and 2100, the higher emission scenario shows a temperature increase of 5.9 F that is more than twice as large as the one for the lower emission scenario (2.7 F).
However, when focusing on rainfall, on the right, regardless of the emission scenario, the NOAA forecasts that rainfall in Marin County will actually increase over current levels. Notice the Marin County rainfall levels that NOAA records are around 40 inches because they do not use the Lake Lagunitas station. Thus, the NOAA rainfall levels are not directly comparable to the ones at the Lake Lagunitas station provided by the MMWD. Nevertheless, the NOAA rainfall trends are most representative anyway.
So, why is Marin County's rainfall not projected to decrease but actually increase due to Climate Change, according to the NOAA projections? It is most probably due to its local topography. The Westerlies winds that feed Mt. Tam with moist air are not going away; and neither is Mt. Tam. Marin County has a micro-climate structure that is pretty sturdy. It is here to stay. The rise in temperature will cause the Westerlies winds to carry more moisture. And, even if Mt. Tam's orographic lift effect is slightly diminished (by the rise in overall temperature), the first factor [Westerlies carrying more moisture] is expected to more than compensated for the second [potentially slightly weaker orographic lift effect].
So, is Marin destined to become a desert? Nope.
If you are interesting in exploring other issues associated with the MMWD water supply, I have attached my report on the subject as a pdf file.
[1] As clouds hit Mt Tam, the air is forced upward. As air rises, it cools, and can hold much less humidity. The humidity condenses and falls… that is rain.