
Blog Post < Previous | Next >
G. Lion
Ross Valley Measure E unlikely to pass
If it does it would be a wild upset.
The Ross Valley School District (RVSD) placed Measure E to renew and raise a parcel tax to shore up the finance of its school operations. For more information on Measure E, you can refer to my earlier article on the subject.
Ross Valley School District Measure E
Voters recently cast their ballots on Measure E. So far, 3,290 have voted ‘Yes’ and 2,206 have voted ‘No,’ resulting in a current approval rate of 59.9%. However, since Measure E requires a two-thirds majority (66.67%) to pass, it may appear to be within reach — but statistical analysis suggests otherwise.
To assess the likely final outcome, we can treat the current vote count as a representative sample of the total vote. For context, traditional polling typically relies on a sample of about 1,000 respondents, yielding a margin of error of approximately ±3% at a 95% confidence level. In this case, we have a much larger sample of nearly 5,500 votes, which reduces the margin of error significantly — to around ±1.3%. That’s good for accuracy, but it also confirms that the current ‘Yes’ percentage is statistically far from the threshold needed for passage.
Now we can construct a 95% confidence interval (CI) capturing the range of potential outcome.
The maximum value within this 95% CI is:
59.9% + 1.3% = 61.2%
This 61.2% is also equal to the 97.5th percentile. In other words, there is only a 2.5% probability that the vote’s final outcome comes out at 61.2% or greater. The 2.5% equals the proportion of the area under the Bell Curve that is beyond the vertical red dashed line on the right.
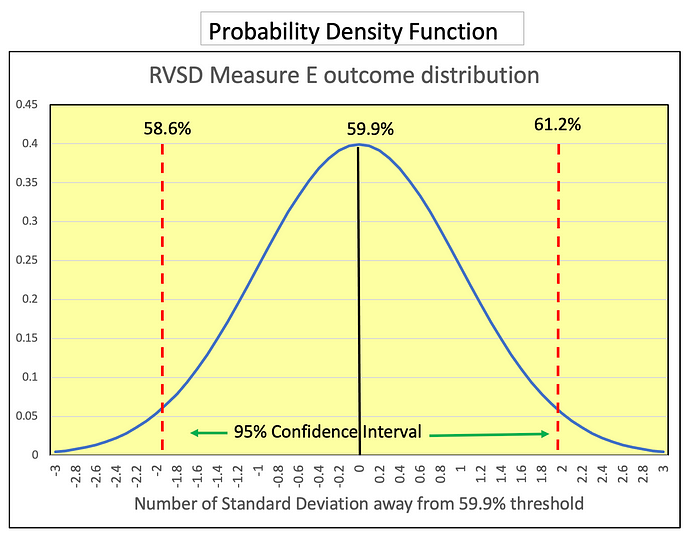
We can also figure out what is the minimum value within the 95% CI:
59.9% — 1.3% = 58.6%
The area between the two vertical red dashed lines on the Bell Curve represents 95% of the total distribution — this defines the 95% confidence interval (CI). Each of the remaining tails outside the CI accounts for 2.5% of the area.
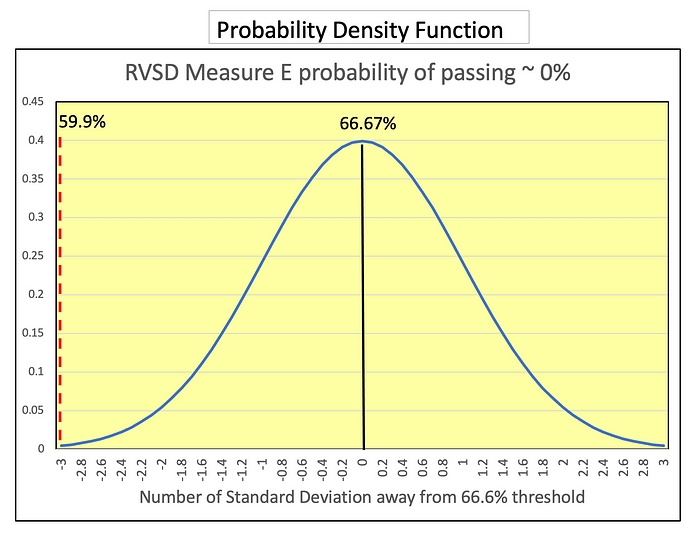
Now, let’s consider the probability that Measure E ultimately reaches the two-thirds (66.67%) threshold needed to pass. As illustrated in the graph, that probability is essentially 0.00%. This is because the current 59.9% approval rate is nearly 10 standard deviations below the required level. For visualization purposes, the graph shows it as only 3 standard deviations below, simply because it was impractical to display such an extreme deviation accurately.
Next, let’s figure out what it would take among the remaining voters for Measure E to pass.
The RVSD has 18,452 voters. And, 5,496 have already voted for a current turn out of 29.8%.
5,496/18,452 = 29.8%
Let’s figure out what % Yes proportion would Measure E need to pass among the remaining voters not yet counted given different turn out percentages. And, here is what you get.
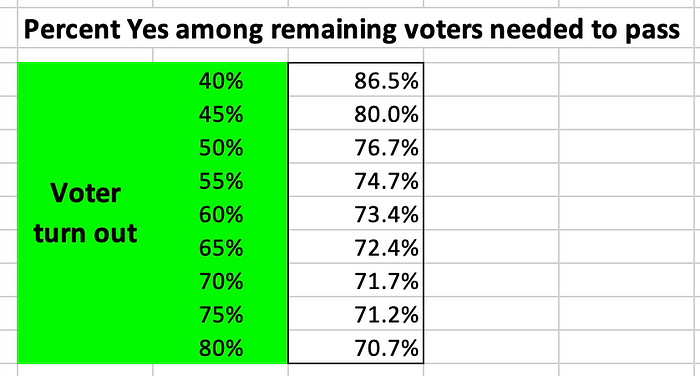
The higher the final voter turnout, the lower the percentage of ‘Yes’ votes needed among the remaining ballots to reach 66.67% overall. That’s just arithmetic. However, the key point is that even the most favorable turnout scenarios still require improbably high ‘Yes’ percentages — more than 10 standard deviations above the current 59.9% level. In statistical terms, a Measure E victory would be a major outlier — extremely unlikely, though not impossible.
For that to happen, the remaining uncounted voters would have to be drastically different from the 5,496 already counted. But that’s improbable, especially since all precincts have reported, which reduces the chance of a systematic difference between early and late voters.
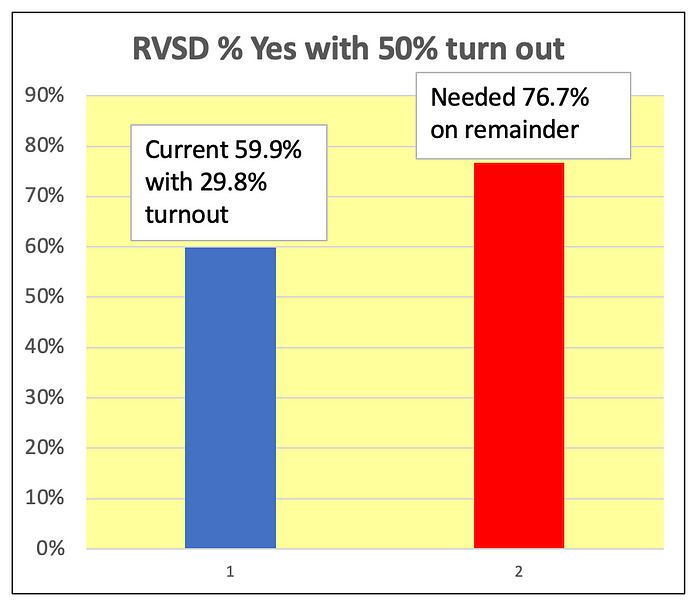
The graph below focuses on the ‘Yes’ percentage among remaining voters needed for Measure E to pass given a 50% voter turnout. The statistical distance measured in standard deviations between the current 59.9% and the needed 76.7% is:
(76.7% — 59.9%)/0.66% = 25.5 standard deviations
That’s a lot!
THE END

Gaetan Lion is an independent researcher with expertise in economics, econometrics, investments, risk management, statistics, and quantitative analysis. His areas of interest include demographics, economics, investments, Climate Change, health care, sports, and politics.