
Blog Post < Previous | Next >

G. Lion
How to resolve the upcoming Marin School Districts' Financial Crisis
Declining enrollment + fast rising costs = very fast rising costs per students
Abstract
Marin County’s public school system is facing a looming financial crisis, driven by a powerful combination of declining student enrollment and escalating costs. Between 2020 and 2024, countywide school enrollment fell by nearly 10% — a compounded annual decrease of 2.5% — largely due to Marin’s aging population. During the same period, General Fund expenditures, in aggregate, rose at an annual rate of 6.7%. This mismatch has led to an alarming 9.5% annual increase in cost per student, with smaller districts showing extreme inefficiencies. Some, like Bolinas-Stinson Union, report per-student costs exceeding $55,000.
Small district sizes exacerbate financial strain, with many enrolling fewer than 1,000 students and failing to benefit from economies of scale. Also districts have proven to be unable to forecast their respective financial conditions. Districts also rely heavily on unsustainable transfers from other funds to inflate General Fund balances, masking deeper fiscal weakness.
The financial outlook through 2027 is grim.
Projected expense growth rates are unrealistically low at 1.1% annually, compared to the 6.1% historical average — despite intense union pressure for double-digit salary increases. This may result in multiple districts falling below the 3% General Fund reserve threshold, triggering potential State takeovers.
To address this crisis, this analysis proposes three key solutions. First, merge Marin’s 16 fragmented districts into a single countywide district to unlock administrative efficiency and funding advantages. Novato Unified, Marin’s largest district, spends 22.3% less per student than the county average; a unified district could generate even greater savings. Additionally, larger districts are more likely to qualify for increased State support through the Local Control Funding Formula (LCFF), reducing reliance on politically volatile parcel taxes.
Second, this analysis calls for non-renewal of the 0.25% SMART train sales tax, which generates approximately $50 million annually — about the same as the projected school district losses. Given SMART’s operational inefficiencies, this funding could be redirected to education.
Finally, canceling the Larkspur Ferry parking lot expansion — an unnecessary and potentially costly infrastructure project — could further free up funds to stabilize school finances.
Together, these reforms offer a realistic and urgently needed pathway to restore fiscal sustainability to Marin County’s public education system.
Data sources:
For this analysis, I have used two data sources.
- When I review the historical period covering the 2020–2024 school years ended June 30, I used the California Department of Education Ed Data available at www.ed-data.or
- When I review the forecast period covering the 2024–2027 school years, I used the California Department of Education Standardized Account Code Structure System (SACS) Data Viewer Financial Reports available at viewer.sacs-cde.org. And, I focused on the most recent reports printed on March 10, 2025. And, I focused on the First Interim multiyear projections General Fund data.
Declining enrollment
Marin County is “old” and aging rapidly.
For more on the subject please refer to this earlier article.
Marin County is as "old" as Italy if not Japan
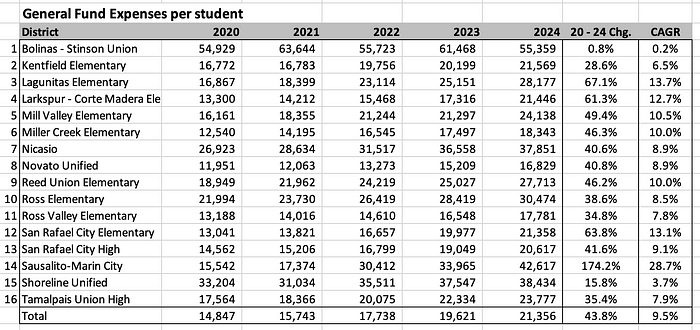
As a result of Marin County’s aging, enrollment within its school districts has steadily declined. Between the 2020 school year and the 2024 one, overall enrollment declined by nearly — 10%, corresponding to a contraction of — 2.5% per year (also referred to as compounded annual growth rate or CAGR). You can see related data at the district level within the table below.
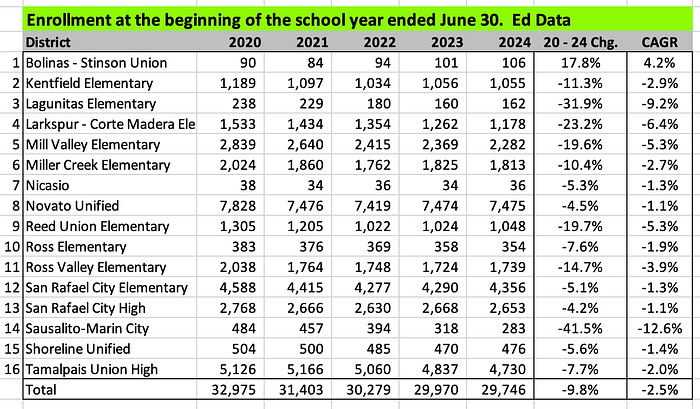
As shown above, the majority of the school districts are no bigger than a regular single school (< 2,000). And, several are no bigger than a single college class (< 400).
When looking at student enrollment on an indexed basis (2024 = 100), it allows us to visualize the contraction in enrollment for each district on a similar scale.
Note that many of the districts’ names have been compressed so to facilitate the coding and data visualization associated with the graph below. For instance, MVSD means the Mill Valley School District which is the same as Mill Valley Elementary. If a district includes the names of two cities, I use only the name of the first city in the graph labels.
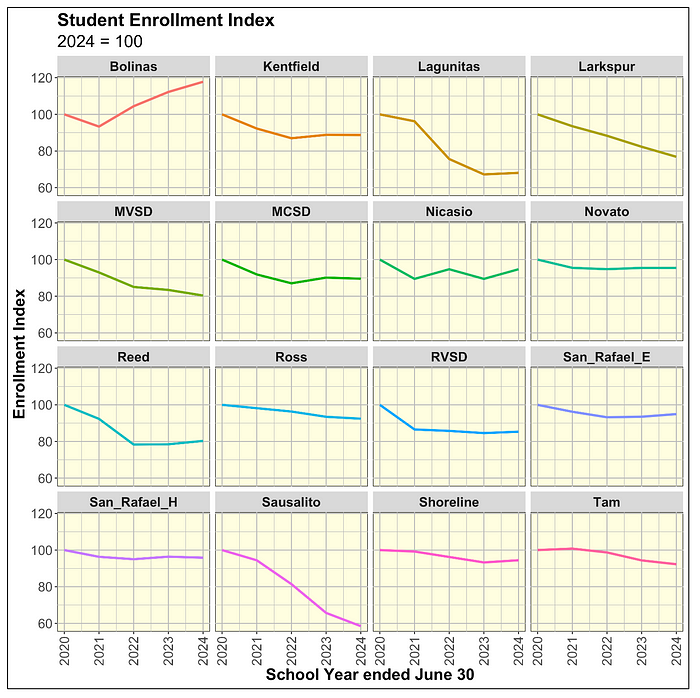
As shown above, many of the districts’ enrolled student counts have shrunk by more than — 20% over just 4 years.
Fast rising costs
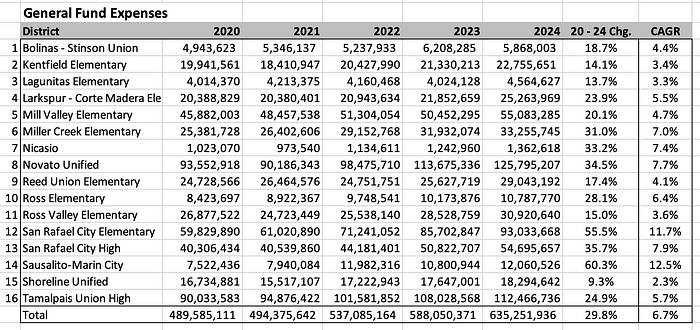
The main operating fund of a school district is the General Fund. Over the 2020–2024 school years period, General Fund expenses have risen rapidly. Indeed, over that period they have risen overall by 6.7% per year (same as CAGR). Some districts have experienced annual costs increase of over 10% such as San Rafael City Elementary (11.7%) and Sausalito — Marin City (12.5%).
Declining enrollment + fast rising costs = very fast rising costs per student
Overall when you combine a — 2.5% decrease in enrollment per year with a + 6.7% increase in expenses you get a + 9.5% increase per year in expenses per student. The underlying arithmetic is kind of interesting:
-(1-(1+6.7%)/(1–2.5%)) = 9.5%
Slight discrepancy in the above calculation is due to rounding.
See related data at the district level below.
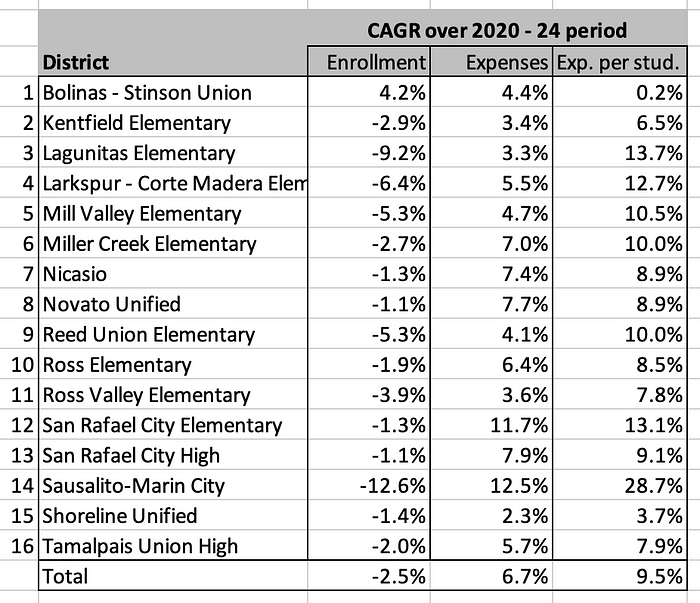
See below data related to underlying General Fund expenses per student at the district level over the 2020–2024 school year period.
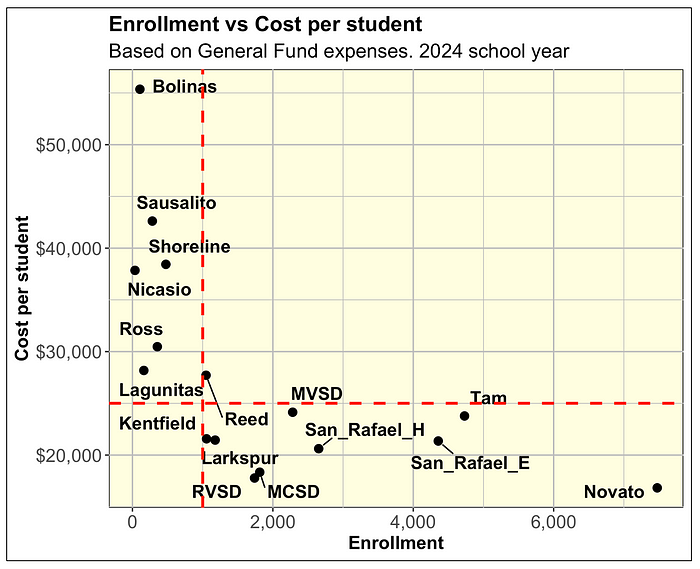
The scatter plot below explores the impact of economies of scale. The plot conveys that small districts with enrollment of less than 1,000 (red dashed vertical line) have cost per student typically much above $25,000 (red dashed horizontal line). As shown, the Bolinas — Stinson Union District has a cost per enrolled student of over $55,000. Such high costs may not be sustainable.
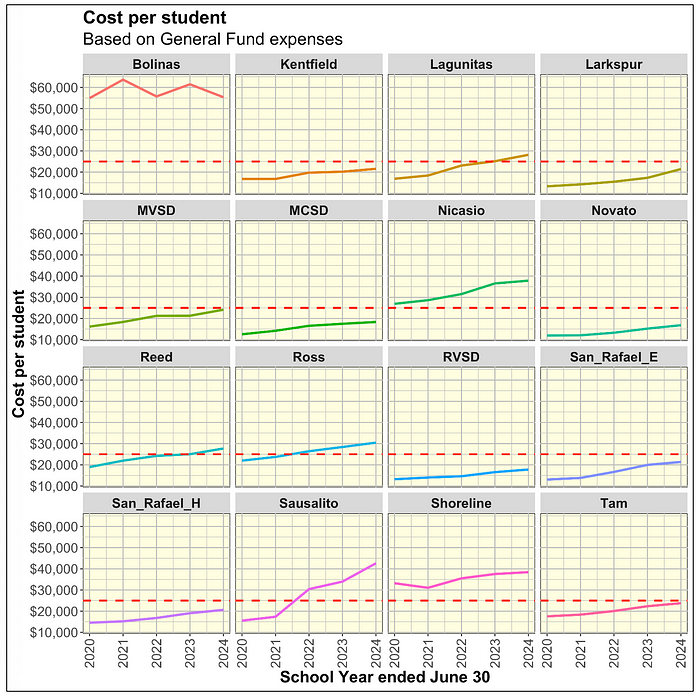
The facet graph below shows the cost per student as a time series over the 2020–2024 school year. The small districts with enrollment of less than 1,000 are the ones with cost per student much above the $25,000 (red horizontal dashed line).
Districts inability to forecast
The table below shows the districts’ net margin. The latter is equivalent to a net profit margin in the private sector. In this case it is calculated as:
(Revenues - Expenses)/Revenues
The current net margins for the 2025 school year are based on the most current estimate disclosed in the SACS report multi year projection (MYPI) dated March 10, 2025.
The forecast net margins were projected in the same report in 2023.
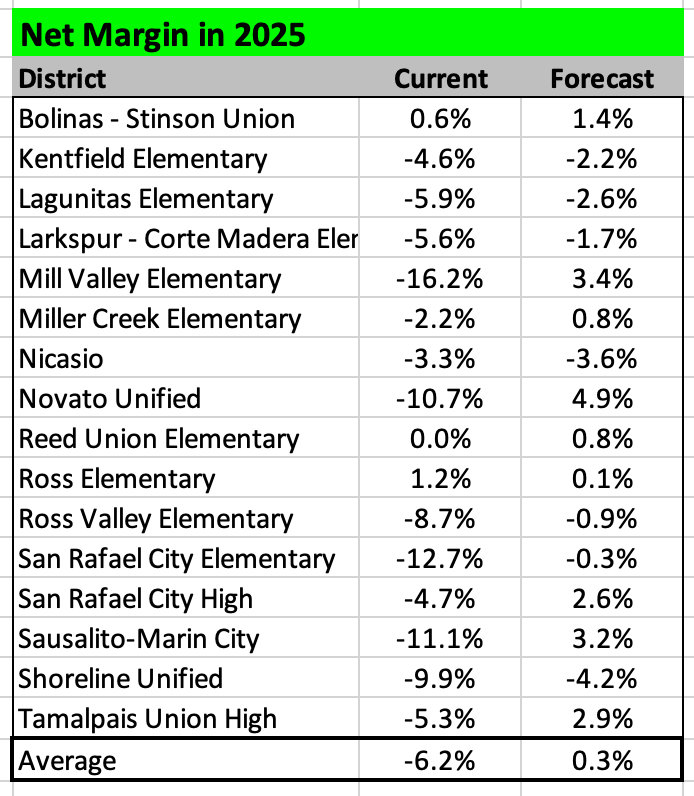
The main point of the above table is that the districts are unable to project their respective financial conditions just 2 years out. The differences between the current and forecast net margins are way too large. And, they are always biased on the positive upside. 14 out of the 16 districts were way too optimistic in forecasting their respective net margins just two years out.
Projecting a district’s net margin just two years out reasonably accurately is possible. I tested this hypothesis with the Los Angeles Unified District, the largest school district in California. And, they pretty much forecasted their net margin right on the money.
An error of + or - 2 percentage points would I think be acceptable. But, the Marin districts’ errors in average are more than 3 X that level. Many districts’ forecasting errors are 6 X that level. That’s not good.
Below we are visualizing the same data on a scatter plot.
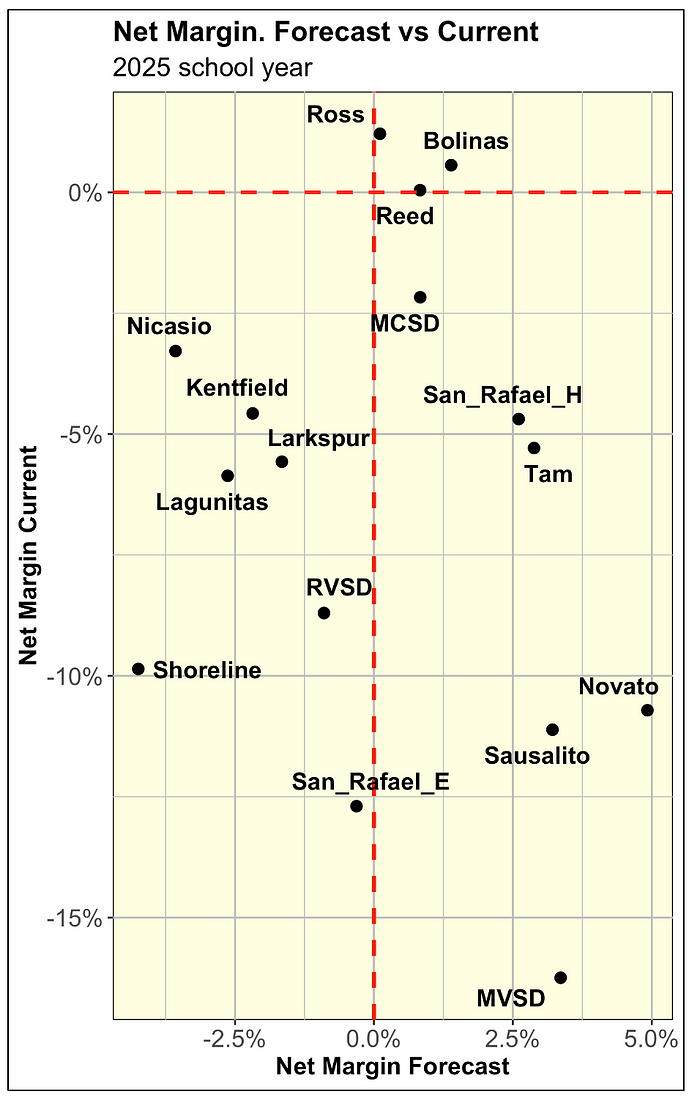
The main point of the scatter plot above is that the districts’ forecast of their 2025 net margin was most often way overstated into the positive territory to the right of the red dashed line. Meanwhile, the most current estimate of their 2025 net margins was mainly way into negative territory to the south of the horizontal red dashed line in negative territory.
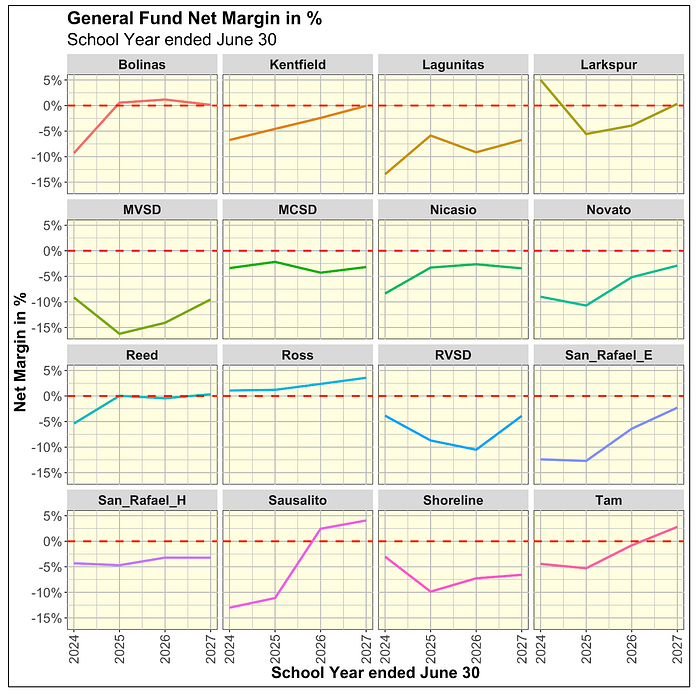
Net margin projections out to the 2027 school year
In view of the earlier testing of the districts’ forecasting ability, one may not vest much confidence in the projection out to 2027. As a counter factor, these projections appear conservative as the vast majority of these projected net margins are negative.
Projected General Fund balance ratio in 2027 school year
The General Fund balance ratio is calculated as follows:
General Fund balance/Expenses
Within the private sector the General Fund balance would be called retained earnings within the equity accounts on the right side of the balance sheet. And, the ratio would divide retained earnings by all the expenses within the income statement. This would measure how much retained earnings a company has in reserve to cover expenses.
Within the table below I compare “Calculated” vs “Forecast” ratios. The Calculated ones are calculated by adding the net margin in $dollars in 2025 to the General Fund balance in 2024 to derive the 2025 balance. And making this simple calculations until 2027. And, dividing the resulting 2027 General Fund balance by the 2027 expenses. In the private sector this would corresponds simply to adding the net profit in 2025 to the retained earnings in 2024 to obtain the retained earnings in 2025, etc.
See the table below that discloses the large discrepancy between Calculated and Forecast.
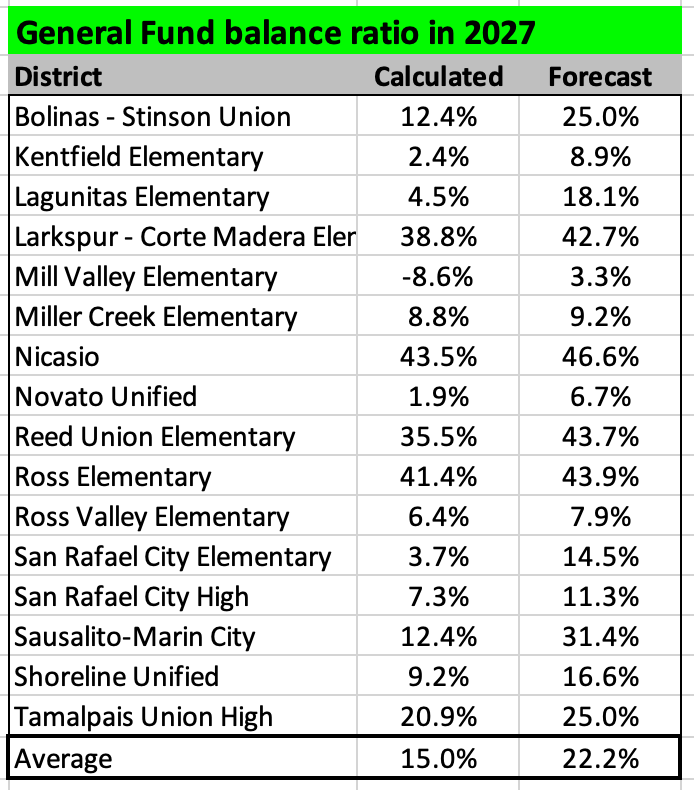
In most cases the Forecast ratios are way higher than the Calculated ones. How can that be? When the Forecast ratio is much higher than Calculated, it indicates that the General Fund balance is to be supplemented by transfers into it from one of the other district funds. These other funds include:
- Special Revenue Funds
- Capital Project Funds
- Debt Service Funds
- Permanent Funds
Some of the above funds may have restrictions regarding the transfer of funds into the General Fund. However, overall there is no doubt that the districts are projecting very material transfers from one or more of those four funds into the General Fund to boost its balance level much above what it would be otherwise.
I would think that such practice reduces the quality of the resulting General Fund balance projections; that’s because a district has to rely on surpluses from those other funds to sustain their General Fund balances. And, it may question if that strategy is financially sustainable.
Below see the same data visualized on a scatter plot. Ideally all the dots should line up on the green line. If they did it would indicate that the Forecast ratios = Calculated ratios. And, that the General Fund balances in $dollars were solely accreted from the net margins in dollars.
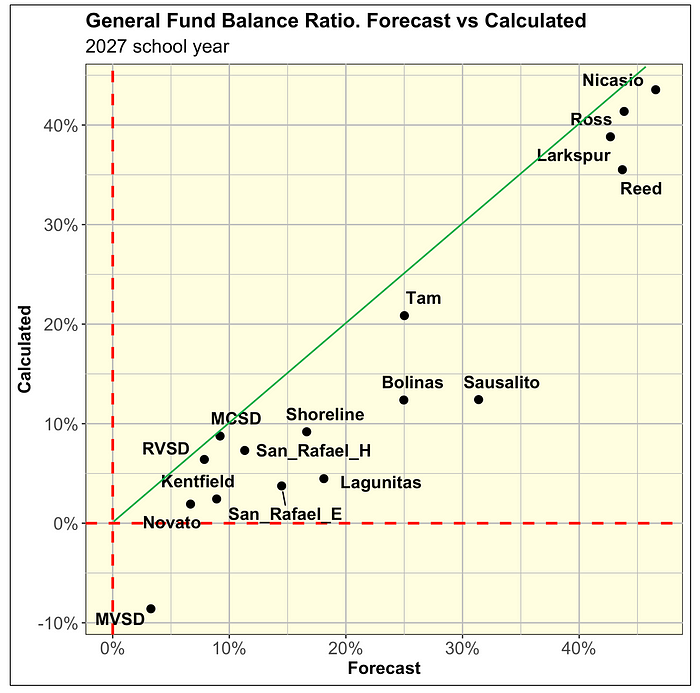
Given how unreliable the Marin school districts forecasts have been, it is likely that:
- Expenses will grow a lot faster than projected
- Net margins will come in much lower than projected
- General Fund balances will also come in much lower than projected
Notice that the 3 items mentioned above make for a causal chain reactions:
higher expenses -> lower net margins -> lower General Fund balances
Expenses are very likely to grow faster than projected. The table below shows how fast expenses have grown over the historical period from the 2020–2024 school years vs how fast they are projected to grow over the 2024–2027 school years.
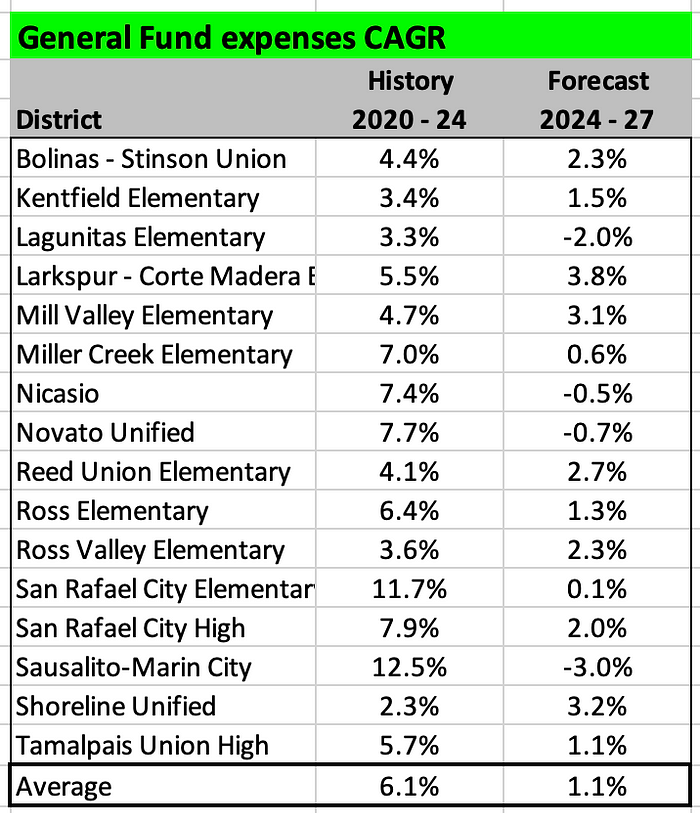
As shown above, in average expenses over the 2024–2027 period are forecasted to grow at only 1.1% per year vs 6.1% during the historical period from 2020–2024. The forecasts appear to be between most challenging to not credible.
That is especially the case when districts are invariably engaged into very tough negotiations with teachers’ unions demanding routinely a 10% raise in salary over the next year and a 4% to 6% one in the following year. The teachers’ unions show little consideration for the long-term financial sustainability of the school district they work for.
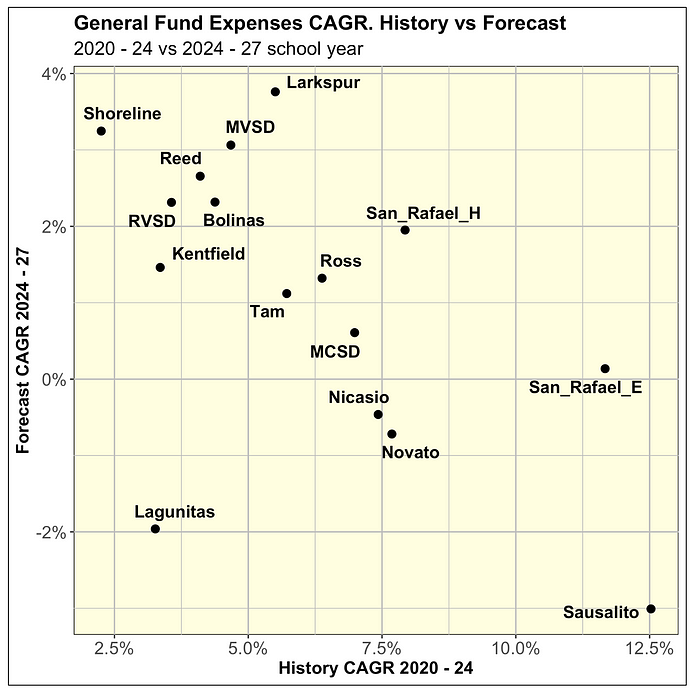
The scatter plot below shows the same data as the table above. The main point of it is that the forecasted expense growth is so much lower than historical one. You can observe that readily by focusing on the sensitivity or range of the x-axis (2.5% to 12.5%) vs the one on the y-axis (- 2% to + 4%).
Given that expenses are likely to grow faster, net margins come in lower, it is not unlikely that several of the districts will struggle to maintain a General Fund balance ratio => 3%. That’s a critical threshold because it represents the level at which the State may take over control of a district. In view of that it is not unlikely that several districts could be taken over by the State over the next few years.
How to solve this prospective Financial Crisis?
There are 3 considerations which could help prevent a financial crisis of the Marin school districts.
- Merge all the districts into a single one. This could have several financial benefits, including economies of scale, and potentially greater funding by the State.
- Not renew the SMART sales tax. The SMART train is ineffective and costly. We could redirect the related sales tax funds towards bailing out or shoring up the financial condition of the Marin school districts.
- Cancel the expansion of the Larkspur parking lot. The existing parking lot’s capacity is more than adequate to cover the need for such parking.
Merging the school districts
Having 16 separate school districts with each their separate administration, HR department, etc. is most inefficient. Having them negotiate separately new salary contracts with the Teachers Unions, is a redundant exhausting exercise.
As reviewed, many of these school districts have less than 1,000 students. At such low enrollment levels the dis-economies of scale get punitive resulting in staggeringly high expenses per enrolled students.
Let’s evaluate the economies of scale benefits associated with merging all the districts into a single one. As a first cut let’s compare the cost per enrolled student of the Novato Unified School District, the largest district with over 7,000 students, with the total for all 16 school districts.

As shown above, over the past 4 years the Novato Unified School District’s expenses per student was in average 22.3% lower than for the aggregate of the 16 districts. This gives us a baseline of potential savings associated with merging all the districts into a single one.
However, the Novato District has slightly above 7,000 students. A single Marin County District would have nearly 30,000 students. Let’s evaluate how much more savings a merger could reap if it achieved additional cost reduction of up to 2% vs the Novato District. The table below shows what the resulting average savings would be vs the status quo.
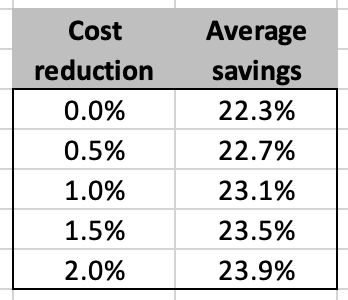
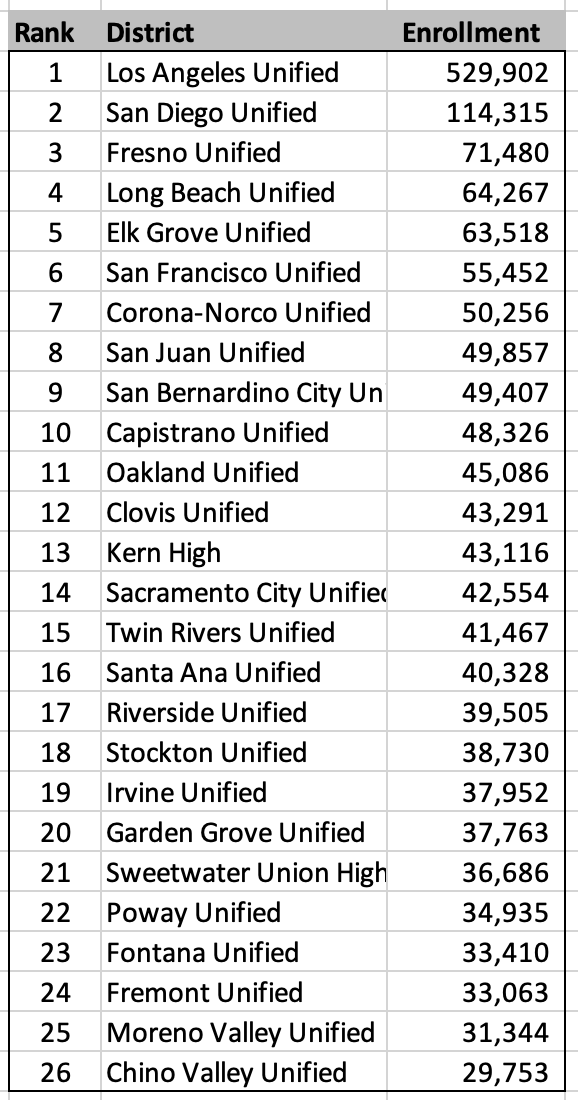
As reviewed, the potential cost savings of merging the school districts into a single one are huge. And, the resulting single school district would not be unusually large. At the end of the 2024 school year, such a single aggregated school district would have 29,746 students. And, it would rank 27th among California school districts.
Merging the 16 school districts into a single one may have another material benefit. Such a larger stand-alone district may potentially receive a lot more funding from the State under the Local Control Funding Formula (LCFF) that is based on average daily attendance (closely related to enrollment level).
As is the far smaller 16 different school districts often opt out of the LCFF mechanism because they do not have an adequate enrollment level to receive sufficient funding from the State. And, instead they opt to shift from being non-Basic Districts (larger districts who benefit more from LCFF) to Basic Districts who rely more on parcel tax.
Parcel tax renewals and increases have become increasingly challenging to pass. This May, the Ross Valley School District failed to pass Measure E, the renewal and increase of a parcel tax it critically needed.
For detail on this topic you can refer to my earlier article.
Ross Valley School District Measure E is All Right to Vote Yes
This Measure E ran into the Coalition of Sensible Taxpayers ($COST) aggressive campaign against it. As a result, it failed to reach the 2/3d threshold to pass. Going forward, I anticipate that $COST will defeat many school parcel tax measures.
A single and much larger Marin School District could rely a lot more on LCFF funding and avoid much of the uncertainty associated with having to raise major parcel taxes subject to 2/3d voting approval that would be vulnerable to $COST campaigns.
Not renew the SMART sales tax
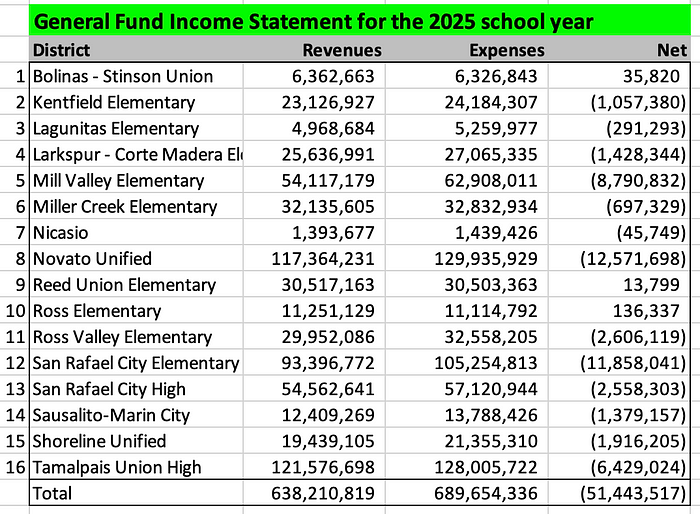
Based on the most recent SACS financial report issued on March 10, 2025, the 16 school districts are anticipated to collectively lose $51.4 million.
Going forward, losses may very well remain at the same level or keep rising.
It happens that the 0.25% sales tax funding the SMART train raises just about the same amount of money or about $50 million a year and rising.
And, the SMART train is a waste. When factoring the traffic jams and delays this train causes at its San Rafael intersection, it has a net negative impact on traffic. And, it is fueled by diesel. So, it does not have any environmental benefit whatsoever.
For more on the subject, please refer to my earlier article.
SMART could waste $1 billion over the next 20 years
The SMART train Measure Q 0.25% sales tax expires in 2029. Marin voters who understands the poor performance of this train should vote against renewing this tax. And, instead we should find a way to redistribute part of the $50 million to support our Marin School District(s). That’s a low hanging fruit ripe for the picking.
Cancel expansion of the Larkspur ferry parking lot
Another low hanging fruit is to cancel the expansion of the Larkspur ferry parking lot. This project is very much related to SMART. The parking lot has an abundance of excess capacity vs commuters’ needs for parking spots. There is no need to expand it.
For more on the subject, you can read my earlier article.
Larkspur Ferry parking expansion not needed
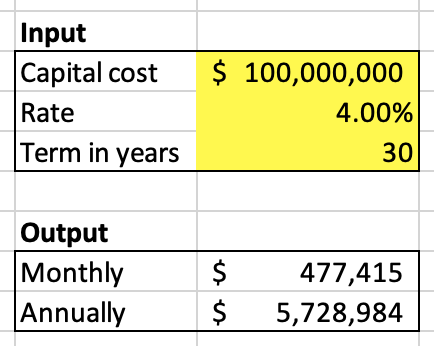
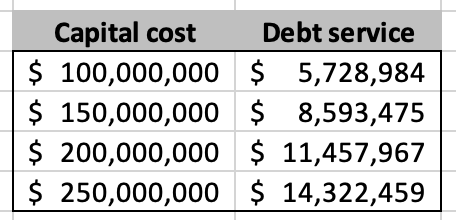
There are no cost estimate on this project. However, the capital costs may well amount to several hundred million dollars. And, the related yearly bond servicing costs are likely to range in the $5 to $15 million per year as explored in the simple model below.
That is a lot of money that should be saved for much more worthwhile priorities such as supporting Marin schools.
THE END

Gaetan Lion is an independent researcher with expertise in economics, econometrics, investments, risk management, statistics, and quantitative analysis. His areas of interest include demographics, economics, investments, Climate Change, health care, sports, and politics.