
Blog Post < Previous | Next >

Debt to GDP - FRED
The US Fiscal Crisis
When the US pays more for interest on its debt than it pays for Medicare or for Defense, that’s a fiscal crisis all right. And, it is getting worse.
A short history of the US Fiscal Crisis
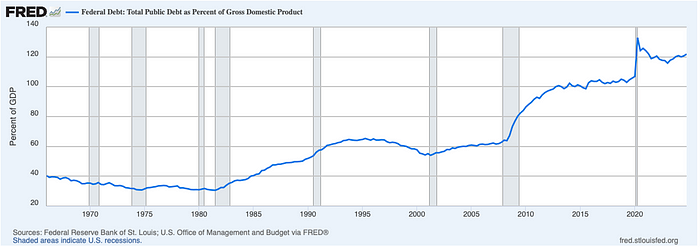
The graph below illustrates that since 1965 the US experienced 8 recessions (gray periods). The blue line shows that over this period the US Debt/GDP ratio rose from under 40% to over 120%. This skyrocketing rise in debt level is at the essence of the US Fiscal Crisis.
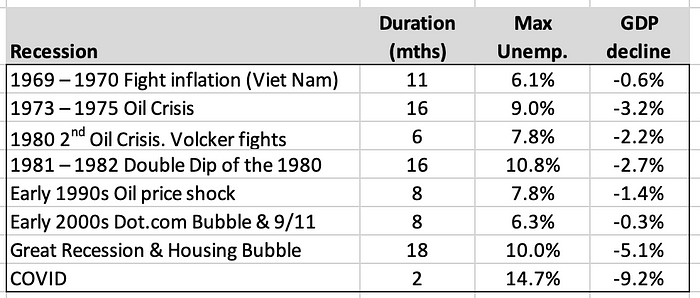
The table below discloses economic data about these 8 recessions including:
- How long they lasted in months
- Their respective maximum unemployment rate (Max Unemp.)
- Economic contraction or change in real GDP (GDP decline)
Next, let’s observe how the US Debt/GDP ratio changed during these recessions. This depicts how the US Fiscal Crisis emerged over time.
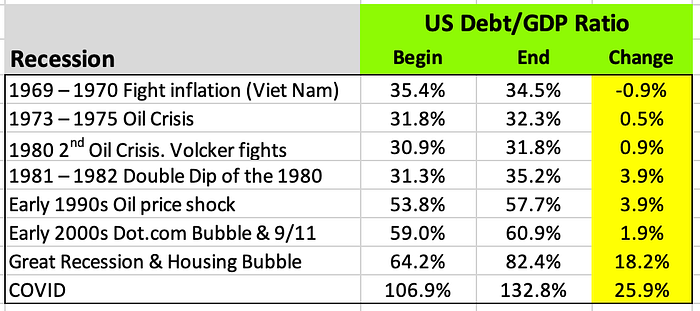
The above data suggest that the US Fiscal Crisis started with the Great Recession back in 2007. That’s when the US Debt/GDP ratio appears to rise out of control.
- During the Great Recession the Debt/GDP ratio rose by 18.2 percentage points: 82.4% — 64.2% = 18.2%
- During the COVID recession the Debt/GDP ratio rose by 25.9 percentage points: 132.8% — 106.9% = 25.9%
However, if we focus on the change in the US Debt/GDP ratio during economic expansions or in-between recessions, we observe that this Fiscal Crisis started way earlier back in 1982.
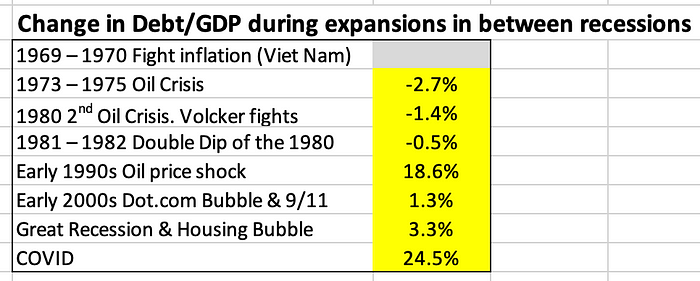
As shown above, between the end of the 1981–1982 Double Dip recession and the early 1990s Oil price shock recession, the US experienced an economic expansion of nearly a decade. But, over that same period the US Debt/GDP ratio rose by 18.6 percentage points.
53.8% — 35.2% = 18.6%
Similarly, between the Great Recession and the COVID recession, the US experienced an economic expansion of over a decade. However, during this economic expansion the US Debt/GDP ratio rose by a record 24.5 percentage points.
106.9% — 82.4% = 24.5%
Thus, until 1982 the US economy was able to weather 4 recessions with very moderate fiscal stimuli while keeping the US Debt/GDP ratio steadily much under 40%. Thereafter, the US pretty much lost control of its Debt. And, through economic expansions and recessions the US Debt/GDP ratio steadily rose to much above 100%.
Next, let’s understand the basic mechanism of how the US Debt/GDP ratio rises over time.
The basic mechanism of the US Debt/GDP ratio
The rise in US Debt/GDP ratio is governed by this simple equation:
Primary Deficit + Interest rate on the Debt - Inflation - Real GDP growth = Change in Debt/GDP ratio
Primary Deficit, Inflation, and Real GDP growth all expressed as a % of GDP on an annual basis
Since 1982, the US Debt/GDP ratio rose because:
[Primary Deficit + Interest rate] > [Inflation + Real GDP growth]
Next, let’s review the the Congressional Budget Office projections published in January 2025.
Congressional Budget Office 2025–2035 projections
Watch out for different Debt data
The Congressional Budget Office (CBO) and the Federal Reserve use different US Debt measures. The Federal Reserve data, that I have used so far, looks at Total Federal Public Debt. Meanwhile, the CBO looks at Federal Debt Held by the Public. Both measures sound the same. But, they are not.
- The Federal Reserve data includes Debt held by the Social Security and Medicare trust funds and other intergovernmental holdings.
- The CBO data excludes those trust funds and other intergovernmental holdings.
As a result, the Federal Reserve Debt/GDP ratio is about 20 percentage points higher than the CBO one. This divergence does not affect my earlier analysis because my main concern is the change of such Debt/GDP ratio levels over time. As long as we use the same measure throughout the time series, the analysis of the change remains directionally relevant.
The divergence between the Federal Reserve and CBO US Debt measures will shrink over time. That’s because both the Social Security and Medicare trust funds are expected to be entirely depleted by 2035. The latter is another angle of the US Fiscal Crisis that I may explore in a later article.
Replicating the CBO projections
Using my simple model comes in handy for replicating the CBO projections conducted in January 2025.
Primary Deficit + Interest Rate — Inflation — Real GDP Growth = Debt increase
In this first step, I use the CBO main fiscal and economic assumptions to calculate the yearly increase in the Debt/GDP ratio (yellow) over the 2024–2035 period.
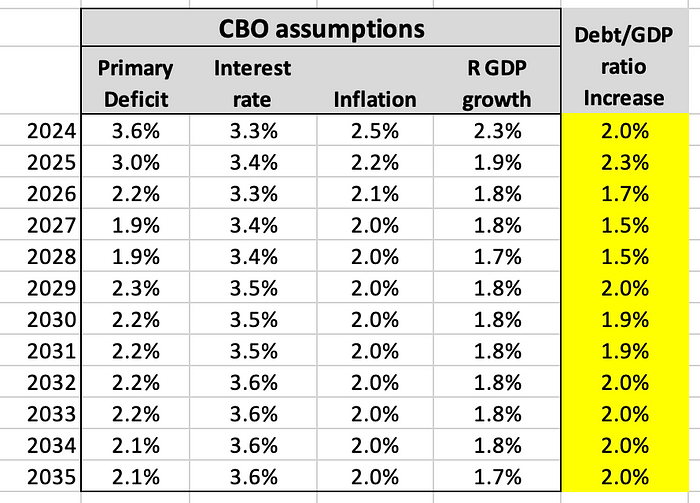
If you follow what is going on in Washington both the Primary Deficit and Interest Rate assumptions seem obsolete.
- The Trump Administration is most unlikely to reduce abruptly the Primary Deficit from 3.6% of GDP in 2024 down to 1.9% by 2027.
- Interest rate on the Debt is likely to rise way above the 3.30% level in 2024. The interest rate on the Debt was low in 2024 because of long-term Treasuries with low rates still on the books. As they mature, and the US has to roll them over at higher rates, the overall rate on the Debt will rise.
The Inflation and real GDP growth assumptions may also be questionable (both appear low). But, they net each other out. Inflation is likely to come in much higher. But, it could be at least partly countered by economic growth also coming in higher.
Going back to the table above, you can see the calculation of the Debt Increase (yellow) that simply uses the equation mentioned earlier.
Next, we can readily calculate projections for the resulting Debt/GDP ratio.
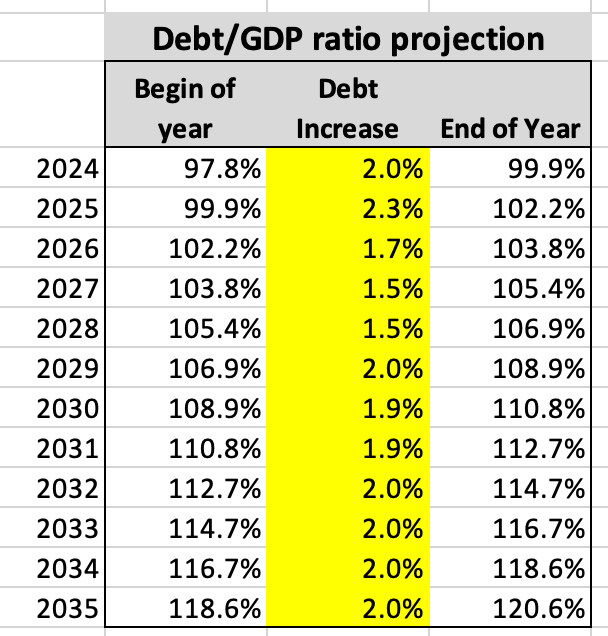
The Debt/GDP ratios at the beginning of the year match almost exactly the CBO projections.
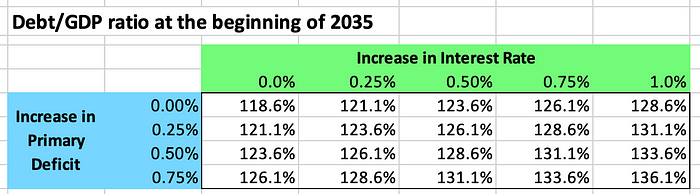
Having modeled the CBO projections is useful because we can now sensitize various assumptions. We are going to sensitize the Primary Deficit and Interest Rate variables by increasing both of them up to 1 percentage point higher than the CBO projections.
I first run these scenarios disclosing the resulting Debt/GDP ratio at the beginning of 2035. When I use 0.0% for both assumptions, I get almost the exact same figure (118.6%) as the CBO projections (118.5%).
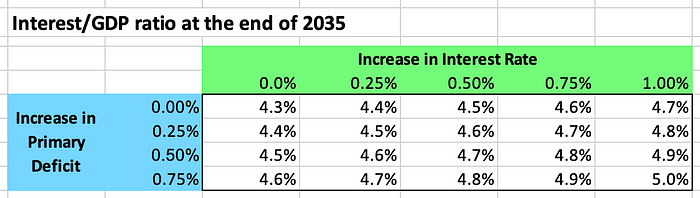
I run the scenarios a second time disclosing the resulting Debt/GDP ratio at the end of 2035.
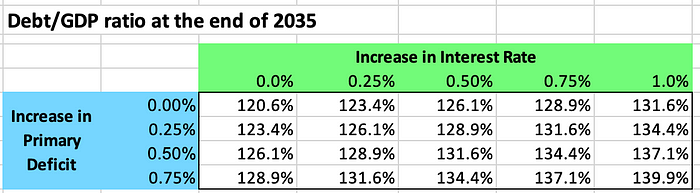
As shown within the tables above, pretty small changes in these assumptions would have a material impact on the spike in the US Debt/GDP ratio.
- A 0.50 percentage point increase in both variables would cause the US Debt/GDP ratio to jump by 10 to 11 percentage points above the CBO projections by 20235.
That’s a huge difference especially when you factor that such increases in assumptions just render them more realistic.
“Interest on the Debt” will be our second largest Federal Government “program”
Just using the CBO somewhat unrealistic projections, Interest on the Debt will be a strong second “program.” Indeed, by 2035 the US will spend more on paying interest on its Debt (4.1% of GDP) than it pays for Medicare (4.0%), Defense (2.4%), all nondefense discretionary programs (2.9%), or all other mandatory programs (2.4%).
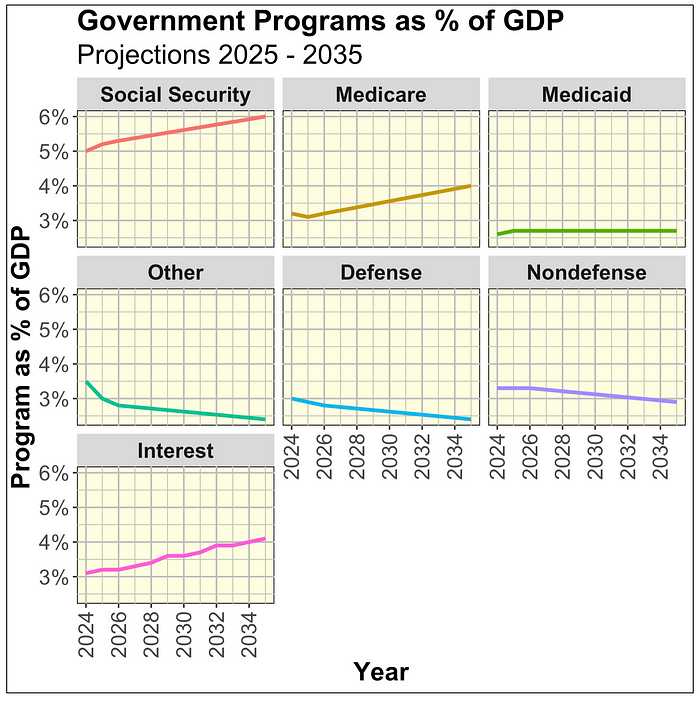
Using my scenarios, Interest on the Debt could realistically reach 5.0% of GDP by the end of 2035.
If we extended such projections for another decade, it is quite likely that Interest on the Debt could even exceed Social Security and become the US Government’s very first “program.”
Our Fiscal Crisis is a huge problem. And, neither party has any intention of fixing it.
As a final note, after adjusting for different demographics, the US fiscal position compares really poorly with other countries. I covered these international comparisons a couple of years ago in the following article.
Click on this link:
Aging Demographics and Unsustainable Fiscal Leverage
Within this essay, I review the impact of demographic aging on the US fiscal position.
THE END

Gaetan Lion is an independent researcher with expertise in economics, econometrics, investments, risk management, statistics, and quantitative analysis. His areas of interest include demographics, economics, investments, Climate Change, health care, sports, and politics.