
Blog Post < Previous | Next >
Guy
California Props Probabilities of Passing
There are 10 Propositions on the California November ballot. You can get more information on these Props at the Voter Guide.

Source: Voter Guide
Upfront caveat
The probabilistic approach I use to figure out the likelihood of propositions passing may be too deterministic. Thus, one should take the probabilities I generate with a grain of salt. On the other hand, these probabilities may be more informative than the customary polls disclosures. They state that if the % Yes and % Nos are less than 6% apart; it is too close to call because it is within the error margin (based on a sample of 1,000 and an error margin of + or - 3%). This borders on the absurd. Check out Appendix 1 for more on the subject.
Unlike polls statisticians, prediction markets traders (at Predict It, etc.) understand and apply the probabilistic approach. And, it allows for more informative differentiation of prospective outcomes instead of just stating nearly everything "is too close to call."
Sports betters also understand this probabilistic approach well. Bellow, I am converting a sample of American odds into their equivalent probabilities.

When looking at the above table, a sports better would be very comfortable taking a bet with any of the above American odds. Meanwhile, a polling statistician would suggest any of these bets are "too close to call" because they are all associated with probabilities of winning of under 95% (which corresponds to the confidence interval associated with + or - error margin).
Regardless of the math, polls are not accurate and not perfectly predictive for several qualitative reasons:
- The PPIC polls were taken two months before Election day. Remaining time = Uncertainty.
- Sampling errors. You can have a small-sample error that is captured by the stats. You can also have a bias-sample error that is not captured by the stats. These often emerge only in hindsight.
Nevertheless, as stated earlier the probabilistic approach is more informative than the "too close to call" framework that is used by polling statisticians (Appendix 1).
Probabilities of the Props passing
Within the table below we just convert Yes % polls into probabilities of passing at the time the PPIC polls were taken in early September.
We do that by first pro rating the Yes and No percentages so they add up to 100% (taking out the % undecided). Next, we figure out the respective standard deviation associated with these polls. Given a sample size of close to 1,000 and an error margin close to + or - 3%, the standard deviation is equal to about half that or about 1.5%. My actual calculations are more specified. You can see additional underlying calculations in Appendix 2.
Once we have the standard deviation, we just need to calculate the difference between the "Yes adjusted" % and the 50% needed for passing. And, divide this difference by the standard deviation. This equals the number of standard deviations above or below the 50% threshold. To figure out the probability of passing, we use the NORMSDIST(# of standard deviation) formula in Excel. This calculates the area under a Bell Curve to the left (this will become clear in a graph I will show in a minute). 
Source for unadjusted polls: PPIC Statewide Survey
The bar chart below shows that 7 out of the 10 Propositions appear most likely to pass as of early September when the PPIC conducted the polls. However, 3 of them do not look like a slam dunk. They are:
- Prop 5 reducing the local bonds pass-threshold from 2/3 to 55%.
- Prop 6 not mandating incarcerated individuals to work.
- Prop 32 raising the minimum wage.

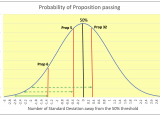
The Bell Curve graph below focuses on the three Props that do not look like a slam dunk so far. Their respective probabilities of passing represent the area under the curve to the left of their respective vertical red line:
- 9.0% for Prop 6.
- 37.1% for Prop 5.
- 62.9% for Prop 32.
As a reference the entire area under the curve is equal to100%. Thus, Prop 32 captures 62.9% of that whole area. And, it corresponds to its probability of passing as of early September when PPIC conducted the polls.

When looking at this graph above, you can see how any Proposition whose % of "Yes Adjusted" is more than 2.5 standard deviations above the 50% has pretty much a 100% probability of passing at the time of the PPIC polls. This is because it would capture nearly the entire surface under the Bell Curve which is equal to 1 or 100%.
The PPIC disclosed more disaggregated polling information on Proposition 3.
 The PPIC disclosed more disaggregated information on Proposition 36.

How about campaign finance
Let's check if the campaign dollars are flowing in the same direction as the polls or their resulting probabilities. And, let's focus on Prop 5, 6, and 32.
 Source: for campaign dollars: Power Search Campaign Finance
When reviewing the campaign fund raising, Prop 5 (66.6% -> 55%) is rather surprising. Even though Sacramento really wants this Prop to pass, the fund raising has leaned heavily against it (Oppose $30.2 million, Support $5.3 million). I looked several times at this data to make sure I got it right. I just could not believe that the Oppose side had raised nearly 6 times as much as the Support side. When factoring there is still nearly two months left until the election (not factoring early voting by mail), it looks like Prop 5 could go either way. But as of the PPIC polls in early September, it is running 1/2 a percentage points under where it needs to be to have a 50% chance of passing.
Prop 32 (raise minimum wage) is in the symmetric position as Prop 5. It's outcome is still rather uncertain. But, if it can maintain its 1/2 a percentage points above the 50% threshold, it has a greater than 50% probability of passing (62.9%).
Prop 6 (incarcerated don't have to work) is in a deeper hole. And, it appears less likely to pass.Its probability of passing may be inversely related to Prop 36 probabilities. Given that the latter has a very high probability of passing with a strong stand against crime, voters may not be inclined to have a lenient position regarding the lifestyle of incarcerated criminals.
Appendix 1. The "Too Close to Call" dogma.
To illustrate this concept, let's apply it to a different domain: total SAT scores.

The total SAT score has a nationwide mean of 1,060; a standard deviation of 217, corresponding to an error margin of + or - 434. The resulting 95% confidence interval ranges from 626 to 1,494. The 626 value corresponds to the 2.5th percentile. The 1,494 value corresponds to the 97.5th percentile.
Using the polls statisticians' "too close to call" framework, they would not be able to distinguish between two students with SAT scores as far apart as 627 and 1,493. Yet, this is the difference between a student who would not have access to any 4-year universities that do not have an automatic open enrollment policy and an elite student who may have a shot at pretty selective universities.
As illustrated, the "too close to call" framework is way too undifferentiating regarding SAT scores. It is too undifferentiating for anything else as it differentiates only between outliers in the tails of the distribution at the 2.5th percentile vs the 97.5th percentile. Any comparison within the outlier range (or within the 95% confidence interval or + or - error margin) is deemed "too close to call." This does not make sense.
Appendix 2. Probabilities underlying calculations
The table below provides more detail on some of the underlying calculations associated with polls and probabilities.


Gaetan Lion is an independent researcher with expertise in economics, econometrics, investments, risk management, statistics, and quantitative analysis. His areas of interest include demographics, economics, investments, Climate Change, health care, sports, and politics.