
Blog Post < Previous | Next >
Guy
Sacramento housing mandates don't make any economic sense
I am referring to the California Department of Housing and Community Development (HCD) housing building mandates. They are called Residential Housing Needs Allocation (RHNA). The latter mandates the State builds 2.5 million (mainly) rental units by 2031.
We know the demographics are not supportive of this scheme. California's population is projected to remain flat or decline out to 2060. See below my earlier demographic analyses on the subject: (CLICK on the titles to read)
Sacramento consistently overestimates California's population growth
Sacramento's projections for the Bay Area are still way too high
Given that the demographics with flat to declining population growth do not support Sacramento's housing build-up, the resulting economics of housing development projects fall apart.
Let's look at two economic factors associated with the prospective collapse of the RHNA building targets. These are:
- Vacancy rates
- Interest rates
Vacancy rates
As a starting point, let's review this chart of rental vacancy rates and multi-family-starts in California. This chart is often used by housing data analyst, Marc Verville when he explains why RHNA will not work.

The above chart shows that when the rental vacancy rate is greater than 7%, multi-family-starts collapse close to Zero. It occurred in 1994 and 2009. This mechanism is independent of the overall economy. In 1994, the collapse in multi-family-starts occurred while the economy was doing all right.
Within California, using Census data, there are 14.6 million housing units. And, 55.5% are owner-occupied. Thus, we can readily calculate that there are about 6.5 million rental units. Calculation: 14.6(1 - 55.5%) = 6.5
Let's map out what adding 2.5 million new rental units on top of the 6.5 million existing ones does to vacancy rates, given no population growth.
 The table above discloses the original or existing 6.5 million units associated with a current 4.0% vacancy rate. The 2.5 million new units, given a flat population, would be associated with a 100% vacancy rate! And, the overall vacancy rate for the State would be 31%!
We could advance that the 6.5 million original units' vacancy rate would increase given the competition from the 2.5 million new units. The table below sensitizes the vacancy rate of the original units up to 10% (which is way higher than during the history of the vacancy rate going back to 1986).

As shown in the table above even if the original units' vacancy rate rose from the current 4% level to a 10% record level, the vacancy rate on the new units would still be absurdly high at 84%. In all the above scenarios, the overall State vacancy rate remains constant at 31%.
Given Sacramento's housing policy could vacancy rates get even worse? Yes, indeed!
Let me introduce you to the Builder's Remedy.
Vacancy rates with Builder's Remedy
If a city fails to meet its RHNA interim targets, it is subject to the Builder's Remedy. The latter entails that a developer can have a project approved with only 10% of the units earmarked for low-income (called affordable housing) instead of the overall baseline ratio of 40%.
So, that's how the overall picture looks without Builder's Remedy and with it.

Of course, realistically much less than 100% of the new units would be developed using Builder's Remedy. So, let's explore how the overall State vacancy rate moves by sensitizing the percentage of buildings developed using Buider's Remedy.

As shown above, even if a small percentage of buildings are developed using Builder's Remedy, the overall State vacancy rate rises very rapidly above its already absurdly high starting level of 31%.
Let's look next at interest rates.
Interest rates
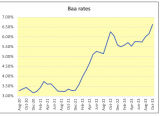
I could not find a good time series of long-term multi-family mortgage rates. But, after doing some research, I uncovered that such rates are probably reasonably close to Moody's Baa corporate bond rates. The graph below shows a time series of such Baa rates going back to August 2020.
 As shown on the above graph, driven by the Federal Reserve raising the Fed Funds rate, the Baa rate has risen rapidly from close to 3.00% in August of 2020 to over 6.50% currently.
Let's explore what such an increase in rates causes to the financing cost of a project (assuming 360-month amortization).
 The table above indicates that rates rising from 3.00% to 7.00% cause an increase in overall financing cost of 57.8%. That means that the monthly mortgage payment on an apartment building would be 57.8% higher at a rate of 7.0% vs 3.0%. It also means that the renters' monthly rent will have to be 57.8% higher! At the same time, this same building's rental income will be constrained by earmarking between 10% to 40% of the units for low-income affordable housing. How is that all going to pencil out?!
The whole RHNA framework is and will be a field day for lawyers. The RHNA Law is outside my sweet spot. So, instead of explaining what I don't know I have attached a relevant short pdf document "RHNA Law" that Amy Kalish uncovered on my behalf. Thanks, Amy, your research was very helpful. And, I am glad to pass it on.
The future of California? Large abandoned apartment complex projects... That's the present in China.

THE END