
Blog Post < Previous | Next >
Gaetan Lion
If not for Mt. Tam, MMWD could not support a single water-customer
The shocking title says it all. Let me explain our local climate situation.
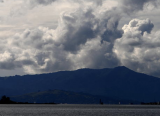
Mt. Tam is truly a magnificent rain factory. Mt. Tam has a front row seat at the receiving end of the Westerlies winds that bring cloud formations carrying moist air from the Pacific Ocean. In turn, Mt. Tam turns this humid air into rain through the orographic lift effect. When clouds hit Mt. Tam, the air is forced upwards and cools down. Colder air carry less humidity. So, the humidity condenses into rain. As a result, Marin County (Lake Lagunitas) that is within Mt. Tam's orographic footprint gets a lot more rain than any other nearby region.
The map below shows that the Mt. Tam area is the only one that gets much above 45 inches of rainfall per year in average.

Because of Mt. Tam, Marin County gets a ton more rain than San Francisco; that is just on the other end of the Golden Gate Brigdge.
See below, a boxplot comparing the rainfall over the 1951 - 2021 period between Marin County (Lake Lagunitas) vs. San Francisco.

Source: Marin County (Lake Lagunitas) - MMWD. San Francisco - NOAA.
Here are some of the rainfall statistics (inches of rainfall peer year) captured within the boxplot.

Over the reviewed period (1951 - 2021), Marin County in its very driest year (20.66) got more rain than San Francisco during an average year (19.69)!
Actually, Marin County (Lake Lagunitas) gets more rain than many West Coast cities, including rainy cities such as Seattle and Portland.

Source: Main - MMWD, other cities - NOAA.
The letters A-B-C-D denote statistical differences between cities. For instance, the mean rainfall between Seattle and Portland is not statistically different. They are both associated with the letter C. Meanwhile, Marin and Eugene respective average rainfall is different as they are classified A and B, respectively.
Related statistics to the boxplot above:

Now going back to Marin County vs. San Francisco, the main difference between the two is their topography. Marin has a large mountain rising 2,500 feet above sea level (which is in turn an orographic water factory). Meanwhile, San Francisco does not have such a mountain. Otherwise, both locations benefit from the same Westerlies winds.
In view of the above, San Francisco is a pretty good proxy for how much rain would Marin County get if it did not have Mt. Tam. It would get about 19.7 inches in an average rainy season.
Given the existing MMWD reservoir capacity, 19.7 inches of rainfall would translate into less than 5,000 acre feet (AF) of water to replenish the reservoirs. This would barely cover water evaporation. And, the MMWD maximum capacity of water it can purchase from Sonoma at 11,000 is just about in line with mandated water releases to sustain our local salmon fisheries. This leaves no water whatsoever for the MMWD 192,500 customers!
Given that Marin has such a splendid natural water factory, why do MMWD customers have to chronically practice austere water conservation while San Francisco residents do not?
It is very simple. It is not about climate, it is about water supply infrastructure.
The San Francisco Public Utilities Commission (SFPUC) has a very resilient water supply infrastructure. It gets its water mainly from the huge Hetch Hetchy Reservoir within Yosemite National Park that is 170 miles east of San Francisco. The Hetch Hetchy Reservoir is fed by the large Tuolumne River that originates in the Sierra Nevada mountain. In other words, San Francisco does not rely on local rainfall.
The vast majority of cities and suburbs throughout much of the developed world do not rely on local rainfalls. Urban and suburban densities would require nearby reservoir sizes that would be unfeasible. Most commonly, such urban areas rely on very large distant reservoirs and wholesalers of water that access distant reservoirs and rivers on behalf of the urban dwellers.
MMWD has an adequate water supply infrastructure during average rainfalll years. But, once rainfall falls below 35 inches for more than one year the MMWD water supply infrastructure is inadequate (example the 2020 - 2021 water crisis). At this stage, the MMWD is relying excessively on local rainfall. The MMWD has been studying this issue for a long time. With a new MMWD Board composition, we can expect much movement on shoring up the MMWD water supply.
If you want to further explore MMWD water issues, I have attached below my research report on the subject.