Blog Post < Previous | Next >

Wikipedia
Marin County promised pension benefits up nearly 1000%, dwarfing rate of economic growth
In this just released data, Robert Fellner shows the even “greater than CalPERS” disparity of Marin County Employees Retirement Association’s (MCERA) promised benefits to Personal Income, Median Household Income, Inflation and Population.
It has become a platitude for Marin County Supervisors to refer, incessantly, to Marin as the “wealthiest county in California”, rarely taking into account that there are many hard working middle income taxpayers who are footing the bills for county extravagances, such as an out-of-control salary, pension and benefit system. As you know, MAPE employees just got a raise that now places them even higher above their counterparts in neighboring counties. MAPE is, of course, part of MCERA.
Please share this information with all your colleagues. Thank you, again, Transparent California and Robert Fellner. You have made it so much easier to track government excesses!
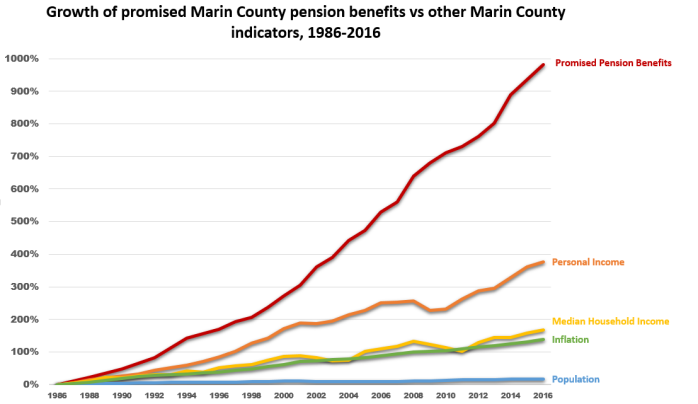
The total pension benefits promised by Marin County increased 982 percent from 1986-2016 — a rate 58 times greater than the cumulative increase in the county’s population, according to a just-released analysis from Transparent California.
Last week, Transparent California released Nearly 900% increase in CalPERS benefits dwarfs economic growth, taxpayers’ ability to pay, which analyzed the state pension fund.
Marin County, however, belongs to the Marin County Employees’ Retirement Association (MCERA), and is thus separate from CalPERS.
Applying the same methodology as used in the CalPERS analysis reveals that promised Marin County benefits grew even faster than CalPERS, as shown in the chart below:

The below chart reflects the cumulative growth in Marin County’s promised pension benefits (accrued liabilities) alongside a variety of Marin County economic metrics:
| Marin County Indicators | Growth from 1986-2016 |
| Promised Pension Benefits | 982% |
| Personal Income | 377% |
| Median Household Income | 167% |
| Inflation | 139% |
| Population | 17% |
Data sources:
- Promised pension benefits reflects the growth in accrued liabilities for the County of Marin and related Special Districts, as reported by the Marin County Employees’ Retirement Association (MCERA).
- Marin County personal income “is the income that is received by all persons from all sources,” calculated and reported by the U.S. Bureau of Economic Analysis.
- Median Household Income data was provided by the U.S. Census Bureau. The Excel Trend function was used to fill in years in which data was unavailable.
- Inflation is derived by calculating the growth in the Consumer Price Index for All Urban Consumers: All items in the San Francisco-Oakland-Hayward, CA region.
- Population data was provided by the U.S. Census Bureau.
For more information, please contact Robert Fellner at 559-462-0122 or Robert@TransparentCalifornia.com.
Transparent California is California’s largest and most comprehensive database of public sector compensation and is a project of the Nevada Policy Research Institute, a nonpartisan, free-market think tank. The website is used by millions of Californians each year, including elected officials and lawmakers, government employees and their unions, government agencies themselves, university researchers, the media, and concerned citizens alike. Learn more at TransparentCalifornia.com.
