
Blog Post < Previous | Next >

SMART
How Much Money has SMART Spent? How much will be Spent before Measure Q Expires?
I have been asked these questions at various times and so I went through all of the financial audit reports, prepared by the Sonoma County Auditor-Controller and those by SMART staff. Table 1 summarizes the results by fiscal year through June 30, 2016. (FY 2016 is based on the budget reports as a financial report for this year is not yet available.)
As indicated, from FY 2005 – FY 2016 SMART spent over $542 million. If one includes depreciation of existing capital, which is not a cash flow, the number is $566 million. The vast majority of the expenses have been in two categories: purchase of capital ($423 MM) and materials and suppliers ($55.5 MM). Also of interest may be the $1.7 MM expense in FY 2012 associated with the extra fees paid to issue a variable rate bond prior to issuing the construction bonds after the “repeal” effort had failed.
Table 1
SMART Expenditures by Fiscal Year and Category in $000

* FY 2016 figures are from SMART’s 2017 budget which includes expenses for most of the above categories.
Beginning in the second half of FY 2017, SMART will begin rail operations. At that point its financial structure changes: instead of using tax and bond financing to finance (along with grants) the $423 million purchase of rail capital, SMART will need to both pay interest on the bonds and subsidize rail operations with the sales tax revenues generated until the measure expires in March 2029.
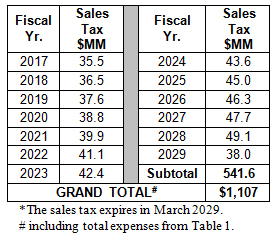
By combining the expenditures with the projected sales tax revenues for FY 2017 – FY 2029, we can estimate how much taxpayers (local, state and federal) will have paid to finance construction rail operations. That is shown in Table 2 and indicates that total expenses in table 1 plus the projected sales tax revenues is greater than one billion dollars through March 2029.
Table 2
Projected Sales Tax Revenues FY 2017 – FY 2029*
Notes and Caveats
- A SMART representative was recently stated in the press that SMART has cost $460 million to date. Without any data to back up that figure, it is not known what they included or excluded from the financial reports.
- In the past few years, SMART has issued “Comprehensive Financial Reports” which provides a “Summary Statistical Section.” Some of data in the above table are consistent with their reporting, but not all of them. There are two issues to be aware of when looking at their summary statistics:
- In SMART’s FY 2015 “Comprehensive Annual Financial Report” their summary table (table 3, p. 40) is incomplete and doesn’t agree with information in Table 2 on the prior page in the same report. It doesn’t include depreciation prior to FY 2014 nor capital expense for FY 2014 and FY 2015.
- The “debt service and interest expense” column in SMART’s “statistical summary” is devoid of useful information because it includes apples and oranges and excludes known interest expense on their bonds. For example, in their table 3, their debt service figures include the refinancing principal of their variable rate bond in 2012, which is a huge number, but not a change in the agency’s financial position any more than a refinancing of a home mortgage is. Their interest payments for FY 2014 and FY 2015 exclude the full interest payments on the construction bonds issued in FY 2012. The difference appears due to the capitalization of interest expenses which reduces accounting entries for interest and related fees in their annual reports. I used the reported cash flows in the above calculations.
- I used SMART’s Sales Tax Revenue projections even though those projections exclude any future recessions and their impact on sales tax revenues. In addition, their projections are sensitive to their assumed inflation rate, which is aggressive because it exceeds the stated policy of the Federal Reserve Board which has successfully targeted a 2% inflation rate.
- Table 2 does not include grant revenues of recent awards that have not yet been spent nor grant funds it has not yet received and so the Grand Total in Table 2 may understate the total taxpayer expense of the SMART rail project from FY 2005-FY 2029.
- A reader might ask about the appropriateness of adding expenditures to date to tax revenues in the future. There are several considerations that make this appropriate.
- Once SMART begins operating trains, there are the gross expenditures of rail operations that need to be considered. As these are in part financed by fare revenues, if I added these gross expenditures to the planning, engineering, and construction costs I would be adding apples and oranges.
- The purpose of this memo is to find out how much have taxpayers paid for SMART. Because SMART floated a large construction bond in FY 2012, it was borrowing against its future tax revenues to finance the bond. If I had use tax revenues to date, I would have calculated a much smaller number in table 1. However, over the period FY 2005- FY 2029 the grand total figure represents the estimate of the total cost to taxpayers over the entire period.